
The Osborne Effect On The Auto Industry
Support CleanTechnica's work through a Substack subscription or on Stripe.
The Coming Car Recession — As Bad As The Great Recession Of 2008?
A perfect storm is brewing above the automotive industry. Three hardly grasped phenomena are working together. Just like a real storm, when the conditions align in the best/worst way, we get a devastating superstorm. These phenomena (or events) are the Osborne effect of delayed demand, the technology (cost) curve of battery prices and other technology, and the S-curve that describes market acceptance of new technologies.
These phenomena are often observed and not very difficult to understand in theory, but our mind is not wired to comprehend the implications. Our mind visualizes simple linear development, direct cause and effect. Together, these three create chain reactions of exponential and logarithmic trends and our mind is simply not able to understand the consequences.
Each of these three can cause disruption of an industry, like the S-curve that hit the mobile phone industry when Apple launched its smartphone. All three working together, amplifying each other, is what is going to happen in a couple of years to the auto industry with the advance of electric cars. Because it is the biggest production industry in the world, it will also disrupt the world economy.
If you don’t want long and boring explanations about these three powers, just jump to the exciting stuff.
The Osborne Effect
At some point relatively soon, the car market will move from having about a dozen viable electric cars to one in which there will be three dozen of them. Most of the new cars will be a better value proposition than what is now on the market. These new entrants will garner a lot of press coverage and word-of-mouth buzz.
The effect will likely be that fully battery electric vehicles (BEVs) will not just be something that only the nerds and very early adopters know about. It will become real for a large portion of the public. Realizing that far better cars are just around the corner, they just have to wait a few more moments for them.
Waiting for the next version of the product you want to buy is called the Osborne effect. According to Wikipedia: “The Osborne effect is a social phenomenon of customers canceling or deferring orders for the current soon-to-be-obsolete product as an unexpected drawback of a company’s announcing a future product prematurely.”
This Osborne effect can also be considered in a broader sense. It could happen to an entire industry when its customers think a new generation of superior products is just around the corner.
The next generation of fully electric vehicles with larger batteries is a far superior generation of products than any vehicle burning fossil fuels in an internal combustion engine (FFV). This opinion is considered a fact by many who know both types of vehicles, and to them, there is “no discussion about it.”
“Luckily,” not many customers are currently aware of this. Otherwise, the industry would be in big trouble already.
The Technology (Cost) Curve
A technology (cost) curve describes the price erosion of a product (type) caused by continuing technological improvements. For an unknown reason, this happens not by leaps and bounds caused by scientific breakthroughs, but with a constant factor over time. The most famous one is Moore’s law, describing the development of computing power as the halving of the cost per transistor and doubling of the number of transistors on an IC every 18 months. (Okay, the cycle has grown to nearly two years, but otherwise still holds). The symmetry of these two characteristics gives this curve a magical beauty.
A technology curve is about a functionality that experiences continued exponential growth in linear time. It is a straight line on a logarithmic scale.
A learning curve is an S-curve describing the improvements in making a specific product. The Tesla Model 3 is in a learning curve, with Tesla consistently driving down production costs. The Model 3 battery is also in a learning curve, with Tesla consistently improving design and driving down battery costs.
There is often confusion about technology (cost) curves and learning curves. They are absolutely not the same.
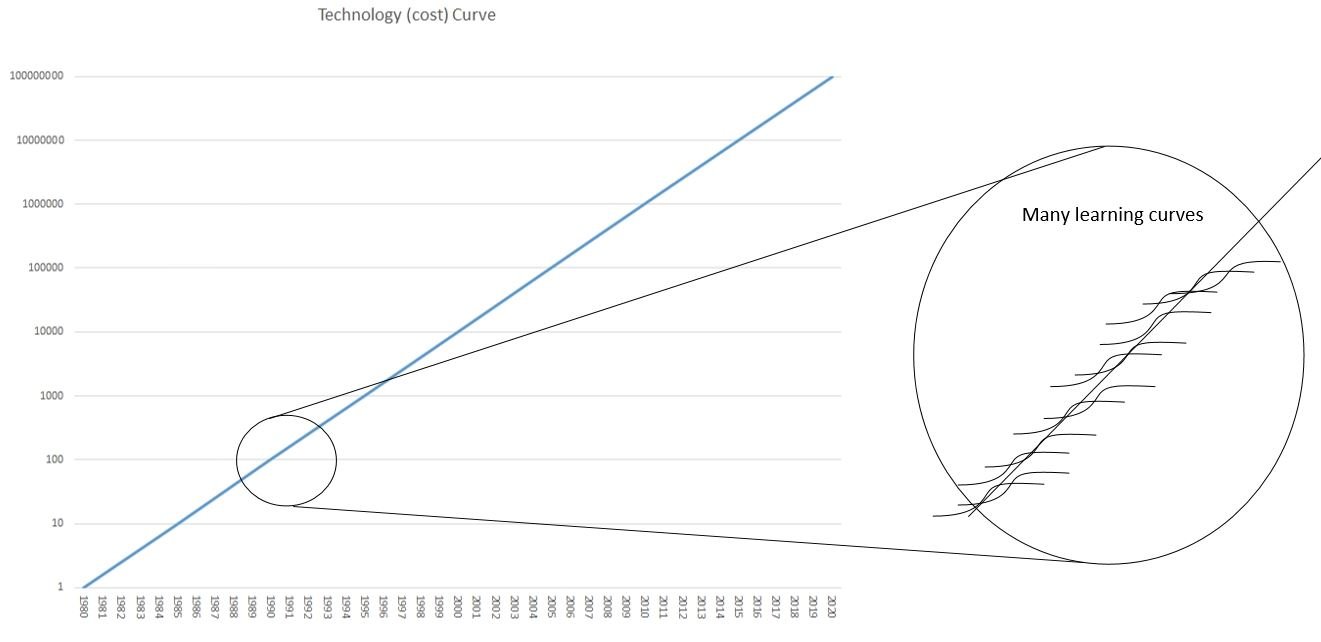
A technology curve results from the culmination of hundreds or thousands of learning curves — progress made in scientific research, in development, and in production. It is the perfect example of a dwarf standing on a giant’s shoulders. It becomes part of the giant when the next dwarf climbs to stand on the shoulders.
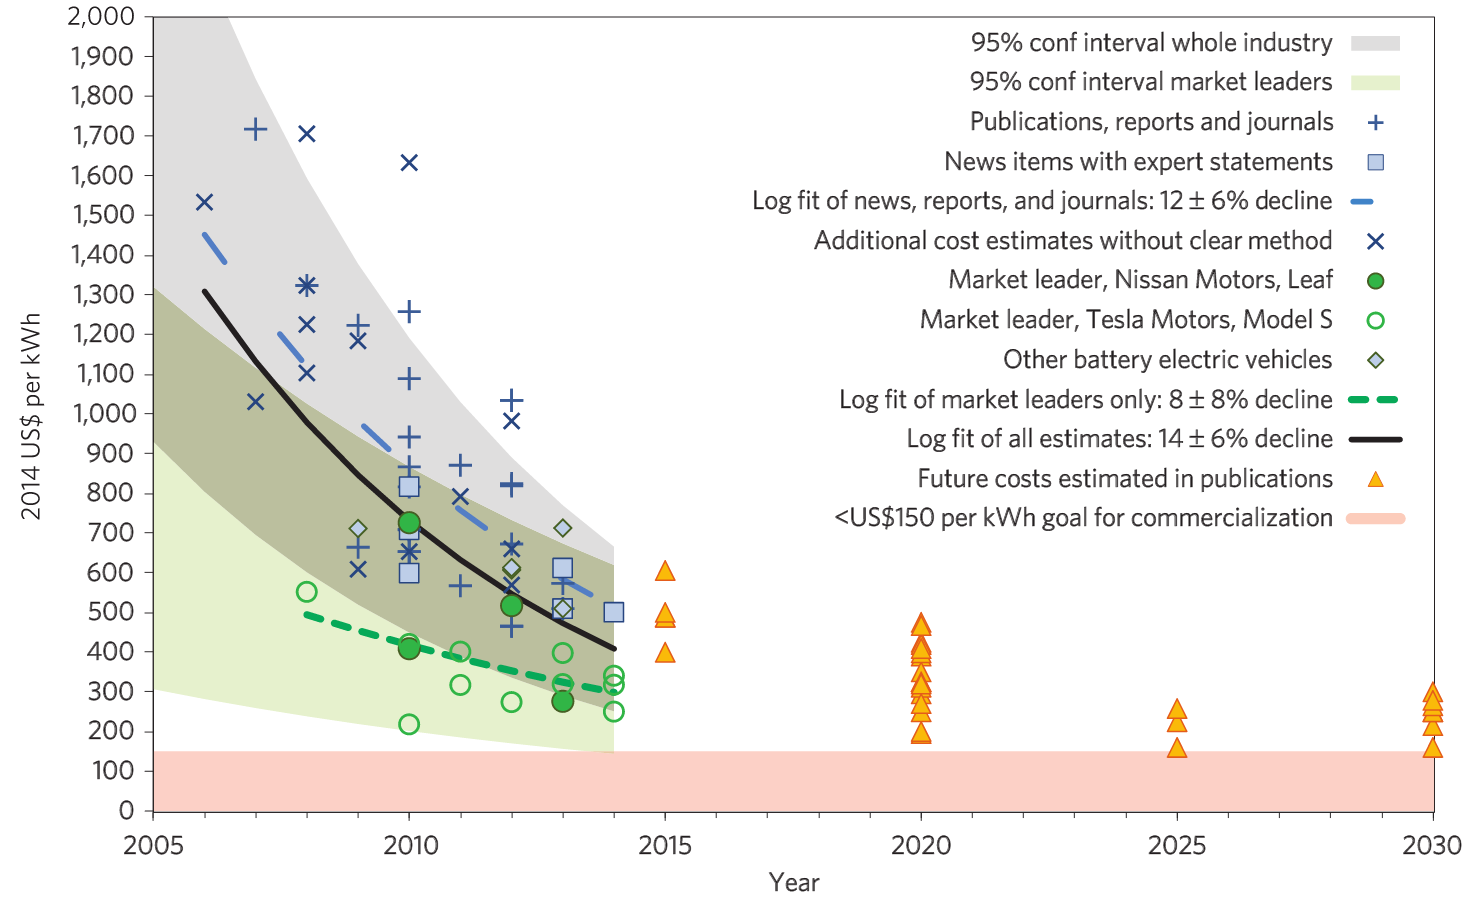
For many products/functionalities, there is a technology curve. For energy storage, the curve is not as elegant as Moore’s computing power curve. What is the same is the indifference to the actual technology used at a point in time. The main battery technology used to be lead-acid, then came alkaline, then nickel-cadmium, and now lithium-ion in many different chemical configurations. In the future, we expect solid-state batteries, and perhaps boxes with nanoscale flywheels, flow batteries, or supercapacitators. While such breakthroughs for a new type of technology can give a one-time jump, overall, the technology curve mostly keeps its pace. The time is progressing linearly on the x-axis and capacity is growing logarithmically on the y-axis.
Many analysts think of battery price improvements as a learning curve combined with economies of scale. This is a fundamental error. When the Tesla Gigafactory has reached its economies of scale and the production processes are optimized at the end of the learning curve, the battery price will not stabilize. It will keep declining according to its technology curve.
The S-Curve
We can credit Tony Seba with making the S-curve of disruptive technology much better known, especially as it relates to automobiles. He starts his presentations with two photos of 5th Avenue in New York City at the beginning of the 20th century. They look the same in many respects and are only 10 years apart. However, there is one big difference. He asks you to find the single car in the first picture among the many dozens of carriages. Next, he asks you to find the single carriage among the many dozens of cars.
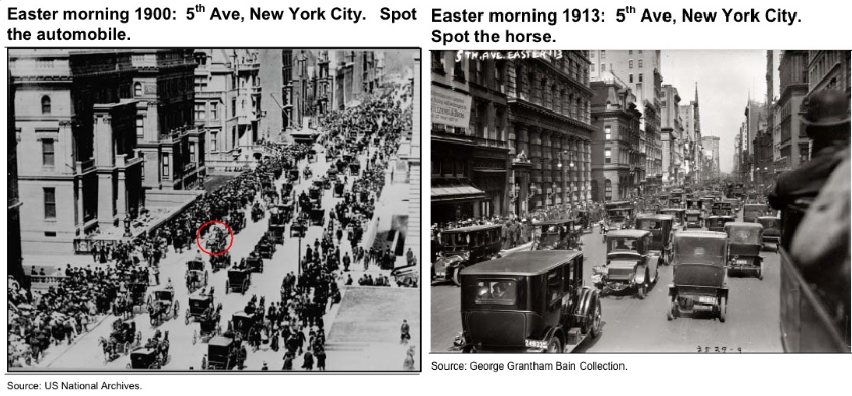
This is his introduction to the S-curve and market disruption. He can explain it way better than me. For a thorough exposition of this topic, view this presentation.
The S-curve graph shows the slow start new technologies have, with the very first early adopters getting to the tech before the mass market can name it, then gaining market share up to an inflection point, and eventually taking over the bulk of the market. In the end, laggards (a technical term for late tech adopters) have no choice but to follow. As a rule of thumb, growing from 0% to 1% can take as long as going from 1% to where the curve flattens again.
The Advance of the Modern Fully Electric Car
Many leading voices in the oil and car industries still see electric vehicles as a niche product. BMW thinks that by 2030, 11 years from now, 85% of its products will have an exhaust and only 30% will have a plug. That is, the company expects that only 15% of its production will be fully battery electric vehicles. The luxury car market is 6 million to 10 million vehicles in size annually, depending on the counting method. Tesla is aiming at close to a half million vehicle sales in 2019, and then plans to grow another 50% in 2020. With the addition of Audi, Mercedes, Jaguar, and Porsche, the BEV market share of the market where BMW is active could grow to ~15% in 2020 — that is 10 years ahead of BMW if BMW’s forecast for itself is accurate.
Bloomberg expects 1,000% (a tenfold) growth between now and 2025, reaching 11% market share for BEVs in the total private vehicle (PV) market by then. It then anticipates another 170% growth from 2025 to about 30% in 2030. That is followed by only 80% growth from 2030 to reach a 55% market share in 2040. Why Bloomberg expects the growth curve to flatten when the products get better and cheaper instead of following the normal S-curve is not discussed.
Bloomberg is by far the most optimistic of the large forecasters. Whether they are oil industry associations, car industry groups, large consulting firms, banks, or financial institutions, they all predict a flattening growth curve or stagnation after 2025–2030. No one offers any explanation why this would happen besides a non-informative “our research shows.”
This next graph shows the relative price development of a battery electric drivetrain versus internal combustion drivetrains in the different market segments.

The price of an electric 60 kWh battery drivetrain is mainly the price of the battery. And there is not much difference between the drivetrain of the former Tesla Model S 60, the Chevy Bolt, or a future Renault Zoe 60. But the prices of the drivetrains with a simple 3 cylinder B-segment engine or with an F-segment V12 twin turbo technological marvel — they are worlds apart.
Looking at this graph, it is clear that in 2010 Nissan could not compete in the C-segment with its Leaf, but in 2012, Tesla was able to compete in the F-segment with its Model S.
Regarding today, it explains why Tesla can tackle the D-segment with the Model 3, and why GM was just too early and too expensive to have a chance in the C-segment with its Bolt, available a year earlier.
The main forces that push the curves on this graph are battery prices and regulations.
- Battery development is on a technology curve. Characteristics of this curve are a ~14% decline in price ($/kWh) and a 6% increase in density (kWh/kg). Combined with power electronics, battery and motor management computers, motors, and gears, a combined decrease of 7% per year is used.
- Environmental concerns call for increasingly stricter exhaust standards, making internal combustion engines and exhaust-treating systems more expensive, resulting in an expected 3% yearly increase.
Looking with this insight again at the graph of the drivetrain prices, it is understandable why after reaching parity with a drivetrain, the BEV drivetrain keeps going down and widens the gap, making the replacement of the fossil fuel vehicle (FFV) drivetrain unavoidable.
For vehicles that need drivetrains with different characteristics, like pickup trucks or heavy-duty trucks that need drivetrains with more motors and larger batteries, prices of the drivetrains are just bigger. This is true both for fossil fuel drivetrains and battery electric drivetrains. The dynamic of the price developments will stay the same.
I often call the above graph an artist’s impression. There is some literature on battery prices, less on power electronics and electric motors. The real production and procurement costs of the car industry for their internal combustion drivetrains is a well-guarded secret. The best I could do was looking at the relative difference in prices between segments for replacement engines, and the historical trend on cost of improvement and compliance. It would be great to have Tesla’s historic and expected battery prices and combine them with Volkswagen Group’s database on engine prices. But if wishes where horses, beggars would ride.
On the y-axis, there are no prices. The dates on the x-axis are guesses based on historic BEV–FFV price development in the E-segment and F-segment, and the known curve of battery prices.
Because of lack of models in the BEV market, I put all the cars, SUVs, CUVs, hatchbacks, shooting brakes (station wagons), and other variants together in the appropriate A-, B-, C-, D- or E-segment.
At this moment, we see a very interesting development in the luxury D-segment. The Tesla Model 3 is competing on price and general “value proposition” with the other luxury ICE vehicles in that segment. The Jaguar I-PACE, Audi e-tron, and Mercedes EQC have a hard time competing directly on price with their fossil fuel cousins, however. They need electric driving advantages, lower operating costs, and governmental incentives to overcome the price premium.
In the non-luxury D-segment, there are no BEV offerings at the moment. They are not even in sight.
The C-segment is starting to become crowded and has many enticing BEVs, especially if you count overlapping with the B-segment. The Renault Zoe and BMW i3 are B-segment on the outside and C-segment on the inside, thanks to the new design opportunities electric drivetrains offer. With the Leaf, e-Golf, four Koreans (Kona EV, Niro EV, Ioniq EV, Soul EV), PSA trio (208, Corsa, 2008), i3, Bolt, and Zoe, we have nearly a dozen in this segment. Most are not available in all markets around the world, but it is a big change from last year.
These models are still too expensive to take over the C-segment from the current FFV rulers — VW Golf, Toyota Corolla, and Honda Civic. However, electric driving advantages, lower operating costs, and governmental incentives enable a serious challenge to these rulers. With the competition among the BEVs and higher production volumes, prices will start to merge towards the prices of their tailpipe-equipped competition. 2021 is expected to be a big crossover year in this regard.
The Perfect Storm
All of these cars will be shown to family, friends, neighbors, and colleagues, creating a growing awareness about what real, modern electric cars are capable of. The quiet, the ease, the torque, and the ample range are aspects not realized by most people until they drive in an electric car, and most people have not driven in an electric car.
At the same time, the charging problem will get solved. That is less problematic than it is often presented to be. It is not one big problem, but a few million small problems that individuals, sometimes with the help of a landlord or municipality, can solve. The dreaded range anxiety will disappear for non-EV drivers after talking to trusted daily users.
This is the mouth-to-mouth chain reaction the EV community is expecting and has been waiting for. Now, what many critics have called vaporware will have a bigger influence than their writers might have envisioned. The VW promise to have 27 new all-electric models by 2022, its plan to have all 300+ models “electrified” by 2025, or comparable statements from Volvo or even BMW will enhance the impression of a coming transition. The public will hear “all 300+ models electric,” in their mind adding “tomorrow,” and will miss “have an electric version by 2025.” The public feeling will be: “If not today or tomorrow, at least the day after tomorrow.”
These public impressions can spread as fast as a wildfire, and be just as destructive to long-planted trees (or OEMs). That is the S-curve of market disruption going almost straight up after years of apparent flat-lining. It is triggered by the public interest in new affordable models, made possible by the technology curve pushing down battery prices.
The result will be that people are no longer interested in buying a FFV. They will start looking for the BEV they envision for themselves and they will find that that electric car is not yet on the market. People will be postponing their next car purchase as a result. They will be waiting until the model or brand they prefer has something for a price they can afford.
Up until now, there is no Osborne effect — not enough people realize what electric cars can do for them. But the moment people start waiting for their new cars, which are right around the corner, there is unmet demand. Unmet demand for products that are not yet for sale translates into a demand drop for the products that are for sale but no longer desired. This is the classic Osborne effect.
That Osborne effect — people waiting for the car they really want — is portrayed in the next graph.
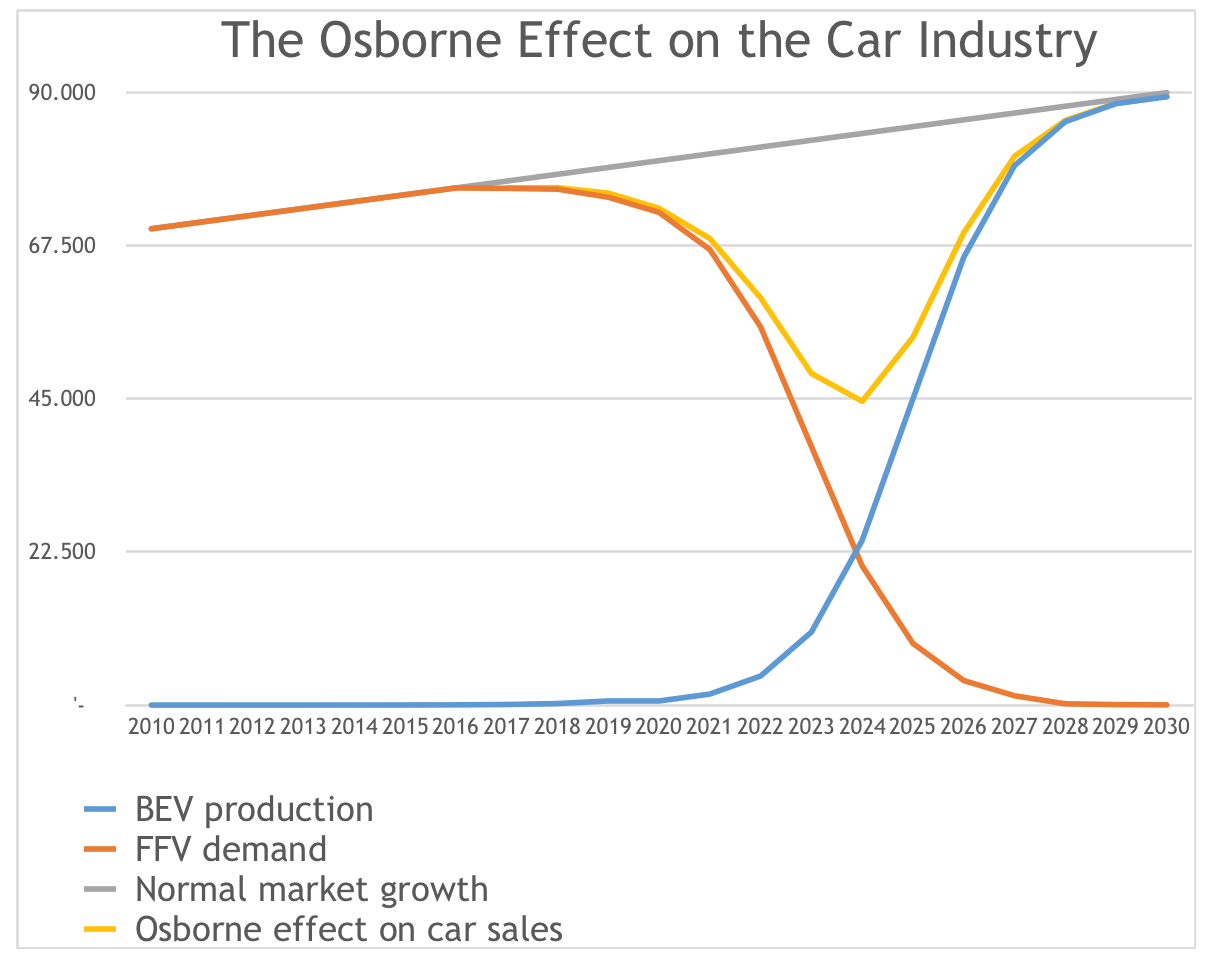
A rule of thumb for S-curve disruptions of the market is that it will take about as long to reach 1% as it will take to go from 1% to the top of the curve. That first part is often not shown, but for those following the market for years, and realizing that we crossed the 1% threshold in 2018, it is included. If anybody is not scared of this graph, read on to enter a nightmare scenario.
The demand for fossil fuel cars is the red line, the wildfire of public perception. The blue line is the carmakers’ reaction to the demand. It is way too optimistic — carmakers can’t scale this fast — but the function I use for S-curves draws it like this. Also, Elon Musk and Cathie Wood (CEO of ARK Invest) mentioned even more optimistic numbers for 2023 in a recent podcast.
Our own Jose Pontes reports regularly about different markets having record growth. Maximilian Holland has also been reporting on FFV sales declines, long waitlists for BEVs, and a problematic lack of choice of good electric vehicles.
Probably at this moment your reaction is: “Ahh well, the carmakers have to do a bit more. Is that your nightmare? Some missed sales and revenue, less profit for the shareholders?”
No, that is not the nightmare. The yellow line is.
That is the size of the car market. The drop is as severe as in 2008, when GM and Chrysler went under and others were saved by bailouts, soft credit, and cash-for-clunkers programs. This time, stimulating demand or providing incentives for buying a car won’t help. It is not a scared public not wanting to spent the money. It is carmakers not having the product for which there is demand.
In an ideal situation, the yellow line would have followed the grey line. That would be the case when the drop in demand for FFVs was compensated by sales of BEVs. For that to happen, though, the blue line has to move to the left — carmakers have to start sooner and prepare for more models in higher volumes.
In the graph for drivetrain prices, the battery prices are slowly going down in the next decade. By far not fast enough to get the car prices on an affordable level for all car buyers. For the car models in the A-segment and B-segment, the battery prices will still be too high to make an affordable car with enough range. That puts a constraint on the industry capacity to move that blue line to the left.
It means we are stuck with the yellow line showing a dip. The nightmare is that it is the car industry falling off a steep cliff. This industry employs tens of millions of people directly and hundreds of millions of people are dependent on the economic activity of those tens of millions.
This yellow line is a big economic worldwide recession. Perhaps only China will escape the worst of it. China is forcing the local car industry to lead the transition, perhaps just enough to have capacity when demand drastically swaps from mainly FFV to mostly BEV.
For the rest of the world, the policy instruments are not in place to do much about it. That is, if policymakers could be convinced that they should do something. There will be cries about creative destruction, the market is always right, and more of that kind of BS.
However, when it is known what is coming, the old structures can be torn down in a controlled way while the new ones are being built. It is possible to do that without a worldwide recession, without tens of millions unemployed, without all the suffering that goes with it — mostly by people who have no influence on the transition.
The crux is “when it is known.” Only a handful of fanboys visiting these enthusiast websites realize what is going to happen. The mainstream media and Very Serious People expect the transition to be painless — “it is only another drivetrain and will happen in 15–25 years; there is nothing to worry about.” The many experts in their echo chambers agree with this, so they must be right.
The Green New Deal is a local and partial answer to this. Judging by the timelines we are now seeing develop in a number of car markets, the Green New Deal, however, will be too little too late.
Wow, did I just say that? The giant socialist overreach of the Green New Deal will be too little too late? Indeed. And we need one in the rest of the world, too.
Images courtesy automakers unless otherwise noted.
Sign up for CleanTechnica's Weekly Substack for Zach and Scott's in-depth analyses and high level summaries, sign up for our daily newsletter, and follow us on Google News!
Have a tip for CleanTechnica? Want to advertise? Want to suggest a guest for our CleanTech Talk podcast? Contact us here.
Sign up for our daily newsletter for 15 new cleantech stories a day. Or sign up for our weekly one on top stories of the week if daily is too frequent.


CleanTechnica uses affiliate links. See our policy here.
CleanTechnica's Comment Policy