Dragon’s Guide To A 100% Renewable Home — Part 5 (Solar Panels)
Support CleanTechnica's work through a Substack subscription or on Stripe.
Welcome back to our series of guides covering how to power your life with renewable electricity. If you’re new to this series, check out the introduction in Part 1.
Articles in the series:
- Part 1: LED lighting
- Part 2: Water heating
- Part 3: Transportation
- Part 4: Home heating and cooling
- Part 5: Solar panels
- Part 6: Cooking
- Part 7: Laundry
Part 5: Solar Panels
3-foot fire setbacks

I live in California, a state known for its sun, but also for its forest fires. To aid firefighters, regulations were changed in 2014 to prohibit installing solar panels within 3 feet of the sides or top of any roof section.
This change in regulations was the bane of my solar install. Our roof is split into two sections, so those 3-foot setbacks cut our roof space down so much that I couldn’t fit a system large enough to offset 100% of our energy use.
These new regulations were actually codified in 2012 in the ICC’s International Fire Code and in the Uniform Fire Code, aka NFPA 1. Each state in America chooses when to start using newer editions of the codes, so not all states are enforcing these setbacks, but they probably all will eventually. This spreadsheet shows over half of the 42 states that follow IFC rules are using the 2012 edition or later. (Note: although it may be called the International Fire Code, they don’t mention it being used outside of the US and its territories.)
I found an article describing the rationale for 3-foot setbacks as well as why homeowners in certain situations (like mine) should be able to get an exemption. Unfortunately, every time I brought up the issue with an installer, they would either say they couldn’t get an exemption, or they would mysteriously stop communicating with me. I guess the solar market is hot enough that they’d rather work with customers who don’t have any installation challenges.
I got frustrated and busy with EV research and work, letting my solar dreams slip to the backburner for longer than I intended. Then my neighbor installed solar and his panels ended up about 1.5 feet from the roof edges. He said his inspector/installer never mentioned that being a problem. With that as evidence, I started again.
System size may be limited by utility company
If it were up to me, I’d install the largest solar system I could fit/afford and anything it generated beyond what I use would go to make my neighbors greener. Unfortunately, many electric companies won’t let you generate much more electricity than you use. Our utility, Southern California Edison (SCE), won’t let you join their Net Energy Metering (NEM) program with a system expected to generate more than 120% of your last 12 months of power use. If the system is larger, you have to sign a statement saying you’ll be using that extra power in the future. SCE’s contract states, “I understand that SCE reserves the right to further validate that my Generating Facility is sized in accordance with the NEM tariff,” but they didn’t contact me for further validation. It’s possible that my solar installer passed along a copy of the contract for my heat pump and that was enough proof.
I searched online, read the contract carefully, read SCE’s FAQs, and I could not find anything stating what would happen if I generate more than 120% of my actual use over a long period. I asked on a forum and heard about a guy with a system that generates about twice the power he uses, and SCE approved it in 2011 and continues to let it run under NEM. My solar installer also agreed that once a system is connected to NEM, SCE won’t kick you off for overproduction.
On the other hand, I’ve read about cases where SCE won’t let a person start NEM if their system is obviously too large. As a last resort, some of those people were able to disable some of their panels to coax SCE to approve their NEM agreement. SCE doesn’t pay you much for the extra power you generate, so I think they’ve realized that some extra power generation benefits them, but they don’t want too much.
Sizing solar to 100–120% of actual use
 We talked a lot in previous sections about how to estimate how much electricity you need to replace fossil fuel in your life. It would be easier to convert everything to electricity first, then wait a year and look at how much power you actually use. The problem is that even a relatively clean power grid like California’s is still only 30% renewable.
Maybe you’re lucky and live in an area with even more renewable electricity, but in most places, converting things like home heating to electricity will burn more fossil fuel until you add those solar panels. On the other hand, converting a gasoline car to electric results in less fossil use on almost every grid in the USA because gasoline is so inefficient compared to electricity.
To kill your CO2 as quickly as possible, buy your solar system and convert your major fossil energy hogs (heating and transportation) at around the same time. As long as you can show your utility a receipt for something like an EV or heat pump, they should approve your system.
If you can’t afford to do it all at once, try for the EV first because a heat pump without solar could increase fossil use.
Alternately, install enough solar for your estimated future electric use even if you won’t use that much electricity for a few years. If your utility denies your NEM application, disable some of the panels temporarily. Make sure your solar installer knows what you’re trying to do so they can plan the system around a possible need to disable panels (it may be best to use microinverters in this case, which I discuss below). Solar hardware is cheaper than installation labor, so I think it would usually cost less to install too many panels with some disabled than to try to hack in more panels later.
Here’s what your solar system will need to power:
◊ Heating hot water. Estimating this is covered in Part 2.
◊ Electric transportation covered in Part 3.
◊ Home heating covered in Part 4.
◊ Cooking covered in Part 6.
◊ Clothes washing covered in Part 7.
◊ Your current electricity use:
• Sum all your power bills for the last year.
• Adjust for any major changes in use (maybe you got a plasma TV and noticed monthly power use jumped up).
• Subtract anything you already added above (electric heating, EV, etc).
• Subtract energy efficiency improvements in the months before they were installed. This includes things like replacing incandescents with LEDs as suggested in Part 1.
When estimating future use, also consider possible scenarios where electricity use will increase significantly:
◊ Having children
◊ Buying a second EV for spouse or offspring.
◊ Adding a hot tub or pool heater
In our case, our actual use plus the estimates added up to 936kWh per month * 12 months = 11,235kWh per year. At this point, I could have given my solar installer that number and let them design the system. Unfortunately, I like to understand things, so I spent a lot of extra time figuring out what size system I would need to generate that power and even what brand and type of panels would fit on my roof. If that’s not something you want to learn about, skip or skim through the indented section below.
Estimating how much energy solar will generate
If you have 10 solar panels, each rated at 300W, the entire system will produce 10 * 300W = 3,000W. However, it will only produce that much power if the sun hits it at a perfect angle and the panels are at a perfect temperature. With the real sun constantly moving, panels heating up, varying air temperatures, varying wind speed cooling, cloud cover, and so on, it’s very complicated to estimate how much actual power that “3,000W” system will produce. This becomes even harder with climate change altering weather patterns. Nevertheless, a web site like PVWatts simplifies all the complexity to give you a decent estimate based on your climate history and system specifics.
PVWatts needs a few pieces of info that are not obvious how to get. One is the slope of the roof which you can calculate using this guide. If you can’t get into your attic, you can also measure above the roof shingles. In some houses, the plywood directly under the roof shingles overhangs the walls of the house and can be measured from underneath.

Array azimuth can be found using this site. Put in your address, then find the line of the protractor (shown to the right) that points in the direction the solar panels will face. Most people will want to place panels facing as close to South (180° azimuth) as possible. Some choose to point them West (270° azimuth) when having power towards evening is more important, but you get less power overall from each panel. In some areas, you may get more power at a different azimuth: Hawaii’s ideal azimuth is 143° while places in the southern hemisphere would be around 0°.
For the remaining PVWatts entries, I chose Module Type: Premium since I figured I needed over 19% efficiency with my limited roof space and Array Type: Fixed (roof mount) since it’s going on the roof. I left all other values as default.
By testing different system sizes, I found I needed a 6.3kW system to generate 11,235kWh/yr. I took measurements of our roof and made a model in Sweet Home 3D, then attempted to fit various models of the most efficient solar panels in arrangements that left as much space around the roof edges as possible. Leaving 3 foot borders on a 6.3kW system proved to be impossible even with the most efficient, expensive panels available. I needed to get an exception to those 3-foot fire setbacks.
After I had everything installed, I learned about BEopt (Building Envelope Optimizer) which is software written by our government’s National Renewable Energy Laboratory (NREL). Like Sweet Home 3D, BEopt is free. You can model your house with either software package, but BEopt adds a lot of advanced calculations for home energy use. I’m guessing it has a steeper learning curve but it might be worth learning for energy nerds.
Solar panel brands
There are a ridiculous number of solar panel manufacturers to choose from so I only took the time to investigate the ones with the most efficient panels and the best reviews, including positive feedback on forums. LG, Panasonic, SolarWorld, Canadian Solar, and SunPower made the cut. SunPower is famous for making premium panels with a premium warranty and a premium price that adds about $1/W to the total system cost. Panasonic is almost as expensive for similar features. $1/W extra means about $6300 extra for a 6.3kW system and I don’t think that’s worthwhile. If something fails in 10–20 years, there will be better, cheaper options to replace it that don’t cost anywhere close to $6300. Canadian Solar and SolarWorld actually don’t seem to make panels over 17.5% efficiency, but I need to hit over 19% efficiency or the borders on my roof become too small. That just leaves LG, which seems to get some of the most praise on forums and a 4.83 out of 5 star average on solarreviews.com.
Sweet Home 3D showed I can fit twenty LG315N1C-G4 panels at 315W each to make 20 * 315W = 6300W. Divide 6300W by 1000 to convert watts to killowatts and I have a 6.3kW system. Before my project started, LG replaced their 315W panels with 320W panels of the same size, and I found a way to fit an extra one in, so my final system is 6.72kW. This should generate 107% of what I think I need while remaining below SCE’s 120% limit.
Installer estimate will always be low
PVWatts says a 6.72kW system will generate around 12,017kWh/yr. Yet after doing a shade study, my solar installer guarantees only 10,256kWh/yr. If it produces less than that, the installer has to come fix it for free. Installers want to avoid those free fixes, so they give you a low guarantee with the expectation that most systems will produce 10–15% more than their guarantee. That puts actual production at 11,281 to 11,794kWh/yr. That’s reasonably close to the PVWatts estimate and above the amount of power I believe we need to go 100% renewable. Unfortunately, there’s a slim chance that some defect would push it closer to the installer’s estimate and they would have no contractual obligation to fix it.
Note that the installer’s estimate is probably more accurate than PVWatts since I assume the installer pays for better weather data and includes shading information that PVWatts does not.
Does the estimate fit reality?
 The yearly rise and fall of solar energy production from another Southern California solar installation is shown to the right. The Date axis has a weird break because I shifted points on the original graph horizontally to center the halfway point between min and max production. I also added a red trend line by eye. Since it isn’t mathematically fitted to the data points, it will throw off my estimation a little, but it can’t be helped without access to the original data point values.
The arrow points to a power increase when dust was cleaned from the panels (we don’t usually get a lot of rain, though record-breaking arctic warming gave us a torrent this year).
Our system has produced 4,198kWh in the first 157 full days (Nov 8th to Apr 13), which is 26.74kWh per day * 365 = 9,760kWh/yr. That’s far lower than the PVWatts estimate, but that makes sense because the period of time I’ve been generating energy (highlighted in orange) is mostly below the blue line representing the yearly average.
The red trend line crosses the blue half way point around the spring and fall equinox (Mar 20th and Sep 22nd). Taking the average daily energy production around either of those dates and multiplying by 365 will give a much better estimate. My average daily production from Mar 13th to 27th is 37.7468kWh * 365 = 13,777kWh/yr.
That estimate struck me as too high, and extending 15 days of data to the whole year is statistically a bad idea, so I estimated the area under the red trend line and then estimated that my generation has covered 31.4% of that area. 4,198kWh / 0.314 = 13,369kWh/yr. Both estimates show we’re on track to greatly exceed the 12,017kWh/yr PVWatts estimate. Huzzah!
SolarEdge monitor overestimates production
My TED energy monitor (discussed in Part 4) says the solar panels have generated 4,198kWh while the SolarEdge inverter that monitors the panels claims we’ve generated 4359kWh in the same period. They are probably both right. SolarEdge seems to monitor the actual energy generated by the panels but some of that energy is lost when the inverter converts it from high-voltage DC current to the 120V AC current that powers household appliances. The conversion loss is supposed to be only 2–3%, but TED is showing it’s 3.7%. The amount that SolarEdge is off has been up to 6.5% on some days. It seems to be most accurate on days with a clean bell curve of generation and less accurate on days with scattered clouds that create a jagged graph of generation so I suspect the inaccuracy is caused by averaging readings taken every 15 minutes and ignoring power fluctuations between readings. TED takes a reading once per second for much better accuracy.
Shade is evil
This stupid little bit of shade on the edge of one panel drops its power output by 48% compared to the panels next to it!

The shade is only touching 4 out of 60 of the panel’s cells, yet the power drop is enormous. There doesn’t seem to be any way to avoid this power loss. As this explains, each cell (the squares with thick white borders) produces a low voltage. Cells are wired in series with the output of each cell connected to the input of the next cell. In such a series, the small voltage of each cell adds together, but the total electrical current (measured in amperage) that can flow through the series of cells is limited to whatever current can flow through the most shaded cell. It’s like if you put a kink in a water hose, the speed of water coming out the end of the hose becomes severely limited even though only a tiny bit of the hose is constrained.
Panels have “bypass diodes” to let current flow around shaded cells, but the diodes waste a lot of energy when used and it’s expensive to put too many in, so they don’t eliminate the power loss. PVEducation has more technical details if you’re interested, but basically, shade is evil.
String inverters, microinverters, or power optimizers?
Historically, strings of 4 or more solar panels were connected using string inverters that convert DC power output from solar panels to AC power used by home appliances. If you don’t know what AC and DC mean, you can learn here. If any panel in the string gets shaded, the current of all panels drops to the current of the shaded panel. If you have a system that gets absolutely no shade, wiring panels in series might make sense to save some money, but otherwise, avoid it!
Microinverters use a technique called “Maximum power point tracking” (MPPT) to let every solar panel generate its maximum current regardless of shade on other panels. Each microinverter converts the DC output of its panel to 120V AC suitable for running home appliances.
Power optimizers use the same MPPT technique used by microinverters to keep every panel generating its maximum current, but power optimizers send DC power off to a central inverter that converts that power from multiple panels to 120V AC.
Microinverter pros:
◊ Microinverters are physically mounted behind each solar panel and replace the need for one central inverter. This can reduce the number of metal conduits running around your house to a central inverter.
◊ Inverters are the most common solar system component to fail. If a microinverter needs to be replaced, that’s much cheaper than replacing a large central inverter.
◊ If you might add more solar panels later, microinverters let you do that easily without replacing a central inverter with a larger one.
Power optimizer pros:
◊ The area behind the solar panel gets hot and inverters are the most sensitive part of the system to heat damage. Microinverters generate more heat than power optimizers. For awhile, microinverter manufacturer Enphase had a lot of problems with failures, though in the last couple years they seem to have solved the reliability issues. It may be too early to be sure of that, but as long as they don’t go out of business, they seem to be good about honoring warranty claims.
◊ The largest microinverters today max out at 280W which isn’t enough to handle the maximum power produced by high-efficiency panels. This explains why you can attach a 215W max power microinverter to a 260W panel, but you do lose out on some energy at the peak of the day when a 260W panel is producing over 215W. Power optimizers have no such limits.
◊ SolarEdge power optimizers have forced Enphase to drop the price of its microinverters and Enphase is now struggling financially. Hopefully they’ll come through leaner and stronger but they also might not survive to provide you with possible warranty service. SolarEdge, on the other hand, is doing well and is even a partner with Tesla on the PowerWall (but not on PowerWall 2).
◊ Power optimizers operate down to 5V while microinverters require 20V or the panel shuts down. Operating for just a little longer before shutdown gives you 1–2% more overall energy from a power optimizer panel.
◊ SolarEdge lists a few more advantages of their power optimizers such as less heat generation that could damage a solar panel and their use of ceramic capacitors instead of electrolytic capacitors that have a shorter life span by their nature.
Power when the grid is down
A lot of people don’t realize that when the grid power is off, even if the sun is out, your solar panels won’t provide you any power unless you have extra equipment. One easy way to keep your power on is to add batteries to the system. Some batteries will power every outlet when the grid is down, others will only provide power to whatever 120V outlets you designated as most critical. You can probably keep your refrigerator going or use a computer, but most solar+battery systems simply aren’t powerful enough for your peak loads like running a tankless water heater or charging an EV at full speed.
Adding batteries to a system reduces available power by a few percent even when drawing power from the solar panels + grid. Since my system is at max size and I worried it might not cover 100% of my energy use, I didn’t want to lose any power by connecting batteries to it, nor did I want to pay for batteries when the grid acts like a battery and is much less expensive.
Nevertheless, I know many readers are in areas where batteries might make sense. First, if you want to go completely off grid, Green Building Advisor explains why that rarely makes economic sense (Hawaii is one of the few exceptions) and why it probably won’t make sense in most areas for many years. They go into detail about the costs and maintenance problems associated with lead acid batteries, then reveal that lithium ion batteries, even in Tesla PowerWall, are not cheap enough to power an off-grid home.
Even once battery costs come down, I doubt most people would be willing to risk days without power when a string of storms comes through and their batteries run out. Climate change is only increasing the risk of solar-blocking weather patterns in many areas.
On the other hand, adding a smaller battery to an on-grid install can cut costs for users that aren’t paid well for excess power generation. It keeps your power on during a failure and it helps the electric utility keep the grid stable as renewables start to power 30% of the grid or more. Read the article for a general idea of what utility policies might cause a battery to save you money, then research the policies of your particular utility company. solarpaneltalk.com is a good place to search for info about your utility. You can also ask a trusted, local solar installer — they should know what’s most economical in your area.
If you want power when the grid is out without the cost of adding batteries, there is only one product that has that feature: The SunnyBoy string inverter. However, its power is limited to 1.5kW. That’s enough for TVs and computers but most refrigerators or heat pumps will probably not be able to start their compressor motor at such low wattage (it takes more to start the motor than to keep it running). The other problem is you need to move stuff you want powered over to that special outlet in the inverter. Since I can get 1.5kW AC by plugging an inexpensive inverter into the cigarette lighter of almost any car, I don’t feel like SunnyBoy’s emergency power outlet is a big advantage. Since SunnyBoy only makes string inverters, we would also make less power as shade from the chimney and trees passes our panels each day (see the section on string inverters above to learn more).
Cost of using the grid like a battery
 DSIRE is funded by the U.S. Department of Energy to keep track of renewable energy policies and incentives in the U.S. One thing they track is how well utilities pay customers for electricity they generate. Dark cyan states like California in the map to the right have statewide policies that utilities must pay customers the retail value of excess electricity they generate. The lighter colored states pay less than retail, or pay nothing at all. The white states have no state-wide policy and individual utilities decide what they want to do.
In California, in any month we use less than about $10 of electricity, we pay around $10 for grid maintenance. This minimum fee actually applies to all customers, even non-solar customers who might just have a vacation home connected to the grid that uses little electricity. So we’re still paying monthly for grid maintenance, but if the solar panels generate significantly more energy than we use, and the retail value of that electricity is over $10 in a month, then we ultimately pay for our grid maintenance that month by generating power. In this way, solar users chip in for grid maintenance just like non-solar grid users do.
Some of the lighter colored states will give you credits for excess generation on sunny days and use those credits to pay for grid power used on dark days, but they reset the credits every month and don’t pay you for excess credits. That means you may pay nothing in sunny months but no matter how much extra you generate, it won’t reduce your electric bill in dark months.
In California, they track a dollar amount of electricity used or generated each month. In dark months, you pay only $1 no matter how much energy was used and they add what remains to a yearly total to be paid at the end of the year. In sunny months, you pay the $10 grid fee but they subtract the dollar value of the electricity you generated from the yearly total. One year after your solar system was installed, if the yearly total is positive, you pay that amount. If it was negative, you can receive a check for that value or request it to be carried over to the next one-year period. They call this one-year period the “relevant period” in their information pages.
Cost of your solar system
People typically quote solar system costs as dollars per watt. Say you’re looking for a 3000W system. If an installer says they’ll install that for $10,000, you divide dollars by watts and get 10,000 / 3000 = $3.33/W. With federal incentives that run till at least 2019, Americans get 30% of that money back the next time they do taxes, so people sometimes quote prices as 30% lower: $3.33/W * 0.70 = $2.33/W. Whenever you look at price quotes on U.S. forums, pay attention to whether it’s before or after the 30% tax rebate. In this article, I will always quote prices before any rebate.
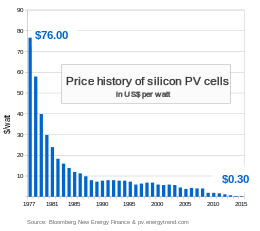 Solar panel prices have dropped so quickly the last few years it’s hard to keep track of what a fair price is. Some people figure they’ll just keep waiting as prices drop, but that drop is slowing. The cost of solar panels now makes up 1/5 or less of the total cost of installing residential systems in the U.S. That means further reductions in panel prices will no longer reduce the total installation cost quickly, and non-panel installation costs have little reason to go down fast. In other words, now is a great time to buy a solar system.
This government site claims California’s average cost is $5.29/W based on what they say is recent data, yet this site (which includes data for the entire U.S.) says Californians pay $3.26/W to $4.16/W. In 2015, Pick My Solar similarly put the California average at $3.60/watt. Based on numerous comments at solarpaneltalk.com, today’s average Southern California price is around $3.50/W for LG panels or similar.
The installer I eventually chose cost $3.25/W plus $1500 to upgrade our main electrical panel to 200 amps which brings the total to $3.47/W. Smaller installs may be able to keep a 100A or 125A panel, but if you’re going to go 100% renewable, you definitely need a 200A panel upgrade.
I also opted to have the solar installer put in wiring for a car charger for $480 because that also qualifies for the 30% tax rebate if installed with the solar system. In fact, if you have other things like the electric hot water heater installed on the same building permit, that should also qualify for the 30% rebate. It seems strange that non-solar add-ons qualify for the solar rebate, but that’s what two installers told me. If anyone has contradicting information, let us know in the comments.
Rebates
 Beyond the well known U.S. 30% federal tax rebate for solar installs, there may be additional rebates available in your area. To check for rebates in your area, click here, then use the Apply Filter button, click State, choose your state, then click the Apply Filters button at the bottom.
Click Apply Filter again, then Coverage Area, then click County or City or Zip Code. Using Zip Code is nice if you don’t live in a big city but the way they force you to click Load More… to show each new set of 10 zip codes is really frustratingly slow in California due to the number of zip codes. Use the Page Down key on your keyboard between clicks to make it faster.
Next, add a filter for Technology > Renewable Energy > Solar Technologies > Solar Photovoltaics.
In my area, I didn’t find anything besides the federal rebate. So many people have installed solar in California that they’ve discontinued the general rebates, though you can still find ones for special cases like low-income households.
When it comes to getting your federal 30% rebate, if you’re using tax prep software (I use TaxAct because they’re the only major player that doesn’t lobby to keep taxes complicated to benefit their business model), all you need to do is enter the installed cost of the solar system. They don’t request proof or any other info. If you can’t find where to enter the installed cost in your software, look for Form 5695 or for “Residential Energy Credits”. The credit will reduce the amount of tax you owe by 30% of your solar system’s cost. Some forms of tax, such as the Self Employment tax that goes towards social security when you’re self employed, can’t be reduced by the credit. If the credit is larger than the tax it can be applied to, the remaining value can be applied in future years for as many years as it takes to exhaust.
Payback period
I didn’t bother to calculate the payback period on our system because I’m not doing it to save money. However, I expect it will pay for itself eventually. To find how many years it will take to pay for itself, you take the cost of the system, subtract rebates, then divide by how much money it saves per year.
In states that pay you retail for your renewable generation, you can assume you’ll pay zero per year for electricity if your panels generate more energy than you use, and you might get a little money back. Say you paid $1,000 for electricity during the previous year. Now you pay $0 for electricity, so you save $1,000 per year and can pay for a $10,000 solar system in 10 years.
In states that don’t pay you well for excess electricity production, the exact savings are harder to calculate and you might need to seek out information by searching online or checking forums like solarpaneltalk.com.
Whatever the payback period, with a 20 to 30 year PACE loan, you will be paying less than you currently pay for electricity in most cases.
Choosing an installer
 I’ve grown suspicious of taking advice from locals when it comes to home improvements. The solar installer my neighbor used quoted me $4.49/W for LG panels which is really high. It turned out he’s a general contractor who subcontracts the actual install, so I’m not surprised he would take a cut, but $1/W above average is huge ($6720 extra for a 6.72kW system). He was friendly but couldn’t answer half my questions and I was educating him on simple things, like the fact the 30% tax credit was recently extended through 2019 instead of expiring at the end of 2016. The credit gradually reduces to 0% for residential solar installations between 2020 and 2023, though remains at 10% for commercial installations indefinitely.
Two years ago, I got quotes from SolarCity and Sungevity. Their prices were high and their reviews were low, so they were out. I still respect both companies because they each did a lot to promote solar and get people to adopt it. Their installation costs are high because advertising is expensive, and I think they sacrificed some quality in order to grow so quickly, which led to mixed reviews. Now that SolarCity and Tesla have merged, I suspect they’ll focus on style and technological innovation for a premium price, which may appeal to some readers but is not my thing.
Both Geostellar and solar-estimate.org are aggregators who link interested customers with good local installers for some unknown fee to the installers. I tried Geostellar in Dec 2014 and got a $3.46/W offer (great for the time) but they were entirely unhelpful with my fire setback problem and with getting me the largest system I could fit. Geostellar subcontracts with local installers but your main contact remains Geostellar — at least that was my experience. On the other hand, solar-estimate.org puts you in direct contact with local installers and their sister site, solarreviews.com, lets people rate those local installers.
In my opinion, finding an honest and skilled installer is much more important than getting the absolute lowest price. In fact, the lowest priced installer is more likely to “get their money back” by cutting corners wherever possible, which will cost you money to repair in the future. With that in mind, I sent emails to a few local installers with the best reviews on solarreviews.com and yelp.com, starting my email with my 3-foot fire setback concern. As expected, some of them ignored me, but better to sift them out immediately. Using email instead of calling was another filter because I far prefer to work through email than to try to work out technical things on the phone. Some installers wouldn’t let me contact them at all other than to send them my phone number so they could call me and likely be pushy. Those installers were also out.
I found a couple decent options but nothing I was too excited about till I saw LA Solar Group mentioned in a few forum posts. I hadn’t looked at them originally because they’re 90 miles away, but they are the only installer I’ve seen with a perfect 5.0 average rating out of a large 129 reviews on Yelp. That’s so good I was actually suspicious they were gaming the review system somehow, but I found many reviews that sounded legitimate and there are actually a (very) few bad reviews mixed in — they’re just overwhelmed by good ones. More importantly, Glassdoor.com rates LA Solar 4.7 out of 5 based on six reviews and you can tell a lot about a company by how their employees rate them.
Planning the system

I was pleased that the representative I was assigned, VV, gave complete answers to my questions and didn’t ignore questions that might be more challenging (unlike every other installer I talked to via email). I learned that LA Solar was founded by engineers and they lean towards recruiting engineer-ish people even in their sales department. I could definitely tell the difference with VV vs the sales-ish people I’d spoken to elsewhere. They also do no advertising, relying on word of mouth and stellar reviews, yet attract enough business to do 90 installs a month. That business model reminds me of Tesla.
Because I’m into DIY home projects, VV and I thought it would be a good idea for me to send them pictures and measurements instead of them sending a rep 90 miles to do a site evaluation. That turned out to be a bad decision because I spent quite a lot of time over-documenting things since I didn’t know exactly what was important to them. Then my info would go to their planners who would come back saying they can’t use that wall because of such and such building code and I’d need to go measure something else. After much back and forth, VV offered to give me a $500 discount for all the time it was taking. I appreciated that, and we got it done eventually, plus I learned a lot.
Flawed roof measurements
The one thing in the process that bothered me was that they used roof measurements from Google Maps instead of the measurements I made with a laser distance meter and double checked with a long tape measure. Google takes an image of the roof from more or less directly overhead, which makes any sloped roof look shorter in one direction than it actually is. Because LA Solar was using inaccurate measurements, their design kept showing they could keep the panels almost 4 feet away from the chimney, yet my measurements showed they could not get over 2.4 feet away. I kept pointing this out because I didn’t want an inspector to notice the installed system didn’t have that magical 3-foot fire safety setback from the chimney and make us tear out some panels or something.
It took forever for me to figure out what the problem was, at which point VV said it didn’t really matter as their design was just to show a customer approximately what the system would look like. She said the official plans that would be sent to the permit office would have accurate measurements, yet in the end the plan they brought with them on the day of install was the same one with bad measurements. There was no problem with the inspector (he never even looked at the solar panels, just the electrical work), but I don’t understand why they didn’t correct it. This may be another case where if LA Solar had sent their usual staff out to take measurements and design things, there would have been no problem.
Permitting
VV warned me that sometimes the permitting department will take a month or more to grant a waiver to the 3-foot fire setbacks. She recommended I send them pictures of my neighbor’s solar install as evidence. That turned out to be impossible because of all the trees and hills, so I ended up buying a relatively cheap drone to get the shot. VV said that going to such trouble wasn’t necessary but it was kind of a fun challenge and the shot, stitched together from two video frames, looks pretty cool:

I don’t know if the photo helped, but after all the worrying and false starts with solar installers that didn’t want to deal with permitting waivers, getting the permit took less than 7 days! In fact, our electric company ended up causing more delays than the permitting office, which is unusual.
Smoke alarms and … toilets?
In California, every time you pull a building permit, you must also sign a paper saying you have smoke alarms and carbon monoxide alarms installed in every bedroom, outside every bedroom, and at least one per floor (even the unfinished basement). The alarms can’t be more than 10 years old.
Apparently some cities/counties add to these requirements. The day the final inspector was to arrive, I got another paper to sign from San Bernardino county stating the same thing about smoke alarms but also stating that all our toilets were 1.6gpf or less, all water faucets 2.2gpm or less, and a couple other water-related requirements. This was the day the inspector was coming so I obviously couldn’t make any changes at that point. The toilet we primarily use was recently replaced with a 1.0gpf model (that we’re very happy with) and we always run the taps at a low rate (I’m not sure what their max gpm is) so I figured we were at least in compliance in our actual water use, so I signed it.
I would be upset at LA Solar for not warning me of these extra requirements except that I’m out of the area they usually operate in. Also, the solar rep who met the inspector said he’d called the inspector’s office to ask if there were any additional requirements and nothing about the water requirements was mentioned. Luckily, the inspector didn’t check anything in the house.
Main electrical panel upgrade
 Any necessary main electrical panel upgrade must be done before any solar panels are installed. To get a main panel upgraded in California requires the electric customer (you) to call your electric company and ask for a “meter spot and unlock”. LA Solar gave me instructions on what to say.
The “spot” seems to involve a building planner coming out to verify there’s no problem with where the new meter will go and he puts an orange sticker on that spot. The “unlock” means to unlock the metal ring around the electric meter that holds the meter in place. Without the ring, you can just pull the meter out and walk off with it. Since all the power to your house runs through the meter, pulling it out cuts off all power to your house.
I got the impression from overheard conversations that in a lot of cities, they’ll unlock the ring and leave it unlocked for a few days while the panel is upgraded. Doing it that way minimizes the amount of time your power is down since the electrician can just plug and unplug the meter as needed. But in our forested area, SCE considers leaving it unlocked to be a fire risk, so we went through this process:
- SCE comes out and unlocks the meter in the morning, but they also disable power high on the power pole
- The old electrical panel is removed
- New electrical panel is installed
- The county building inspector checks the install and tells SCE the work is approved
- SCE returns to restore electricity at the pole and lock the meter
The process takes 6 to 8 hours. We got a lot of house cleaning done.
In our case, the county inspector canceled our appointment date one day in advance, which delayed things by 7 days. In an interesting twist of fate, the new date was Oct 21st, 2016. That’s the 1 year anniversary of when we picked up our EV on Back to the Future Day.

The electricians started by asking a few questions like where was our water main. It turns out they need to drive two copper rods into the ground 6 feet apart and wire those rods to the water main where it heads into the ground. All that grounded metal is wired to the new electrical service panel to create a path for lightning to travel.
The electricians did a good job other than leaving the wood trim around the panel unfinished. He gave the impression I would have to finish it myself, but in the end they sent another person to finish the trim after the solar system was installed, so there was a bit of miscommunication there.
When it came time for SCE to turn the power back on, they were missing in action. After a number of calls made by the electrician, it turned out one of SCE’s trucks had broken down and everything was behind schedule. The electrician couldn’t wait around but he kept in contact via text messages and said he would return if anything went wrong once power was restored.
Finally, at dusk, SCE arrived in the largest SCE vehicle I’ve ever seen (it’s almost twice as tall as that blurry guy near the passenger door):

It was so wide that traffic couldn’t pass once they put down the stabilizing feet for their cherry picker. They hoisted a guy up to the top of the utility pole. I don’t know what they were doing but 20 minutes later we had power again. Hurray!
To celebrate, we watched Back In Time, a Back to the Future documentary available on Netflix.
Solar panel installation
Four days later, LA Solar sent in a team of 5 people who got all the solar panels plus the car charger installed and everything tested in just one day.

I was impressed at their speed and the head electrician was friendly, knowledgeable about building codes, and actually enjoyed going up into our cramped attic to run power lines. He gave us plenty of warning before he had to cut power for about 10 minutes to install the solar-panel circuit breaker. About 20 minutes later, power suddenly went out again for about 10 seconds. The doorbell rang and the electrician said our electric meter had fallen out for a moment before he pushed it back in! Apparently SCE had put the lock on our meter crooked such that it wasn’t actually holding the meter to the electric panel. I find it funny they go to so much trouble to make special locks with keys only SCE has copies of and then fail to install the lock straight.
The installers cleared out around 4:30pm except for Greg who stayed to take a few extra photos of the system and give us a final update. He got this one amazing shot from the peak of the roof where it’s like you can see the solar power in the air:

He mentioned how much cooler the weather was on our mountain and we asked him what it was like to work on roofs in 100F in the summer. He said he was surprised that he got used to it and it just felt normal after awhile. He was also surprised how much stronger he got after a few weeks working roofs. If any readers are looking for a job in construction, sales, or system design, your local solar installer is probably hiring.
Permission to Operate
Even though we had working solar panels on Oct 25th, SCE wouldn’t let us use them until the county inspector came again followed by an internal review from SCE. If we turned it on before SCE gave us Permission to Operate (PTO), SCE could deny us permission to participate in Net Energy Metering, meaning we would get no credit for power sent back to the grid.
On Fri, Oct 28th, LA solar sent another worker to clean up the trim around the main panel and paint all the conduits. Mon, Oct 31st, after the paint had dried, another guy came to apply decals and signs that SCE requires and meet the county inspector. The inspector took about 5 minutes to look at the main electrical panel and inverter, then approved the system. He never looked at the actual solar panels which I think is odd. Someone from the same inspection office looked at my neighbor’s panels and made them add more anchors to the roof because we sometimes get high winds.

Only after the inspector approved the system could LA Solar apply with SCE for PTO. SCE asks for up to 30 days to complete the process, but lately they’ve been getting it done in 3 to 7 days. Maybe they’re not so anti-solar any more? Frustratingly, we hit the long end of the spectrum and they kept us waiting till Monday, Nov 7th, for PTO.
Monitoring
As soon as SCE issues PTO, you can turn the system on. In our case, that meant turning on a big power disconnect to the left of the main panel, turning a big black dial near the bottom front of the inverter, and then flipping a tiny red switch you can’t easily see under the inverter. You can also wait for your installer to send a tech out to do all that. They have to send someone regardless to set up the monitoring hardware that lets you watch the system’s performance. The monitoring hardware consists of a transmitter installed in the inverter and a receiver you plug into your internet router. Transmitter and receiver communicate wirelessly.
The monitoring software for SolarEdge is accessed through their web site, but the service is free. LA Solar created a map of panel physical locations that shows how much power each panel produces:

Notice in the daily graphs along the top, perfectly sunny days form perfect humps of power generation, while cloudy days form jagged peaks as clouds move past.
At first, panels that were physically shaded did not show a power drop in the correct place on the map. It took a few days before that was corrected. Apparently someone had written down the physical location of each power optimizer serial number but that info wasn’t available when the map was originally set up. I get the impression they often set up a quick map with panels at random positions and correct the positions later, perhaps in a batch.
Having panels mapped correctly lets you know where to look for shading on the physical system if you notice the same panel drops in power at the same time each day. I found one such panel in our system (the lower left panel that’s darker than the rest in the above map), and the shade was coming from a tree that I could trim. Throughout the year, the sun shines from different locations and trees are always getting taller so it’s nice to scroll through the 15-minute history intervals periodically to see if there are new shade problems that might be corrected. Even a large owl dropping can have some significant effects, so you can watch for that, too.
Release of lien
If you hang around on solar forums, you will find recommendations that you get a signed “Release of lien” document at the same time you make final payment for the solar system. The document is not actually releasing a lien but releasing the installer’s ability to put a lien on your house if you don’t pay. A lien on a house means you can’t sell the house without paying off the lien, and banks also don’t like giving you loans using your house as collateral if it has any liens on it. The most common problem I’ve seen described is that you actually do pay for the system, but the general contractor you paid does not pay their subcontractors, and those subcontractors come after you for their money because that’s their easiest legal option. I don’t think anyone has to worry about any of this as long as you go with a highly-rated installer, but you can read about ways to protect yourself in California on this site. Personally, I didn’t bother with a release of lien document.
Conclusion

I enjoyed working with LA Solar and if you’d like to get a quote, feel free to support my articles on Cleantechnica by visiting this referral link to contact them for your install. Enter Chris Dragon, solar at dracoventions.com as the name and email of the person referring. As always, I’m not paid by any of the companies I mention in my articles and I wouldn’t recommend them if I weren’t happy with them.
Next time, we’ll talk about electric cooking and clothes washing. I haven’t decided exactly what appliances I’m going to purchase, but an average household will use around 1,596kWh/yr on cooking/clothes, making it one of the smallest home fossil-fuel users which is why I left it for the last step.
Now, go get your solar install started! =)
Continue reading the next chapter of Dragon’s Guide in Part 6: Cooking.
Sign up for CleanTechnica's Weekly Substack for Zach and Scott's in-depth analyses and high level summaries, sign up for our daily newsletter, and follow us on Google News!
Have a tip for CleanTechnica? Want to advertise? Want to suggest a guest for our CleanTech Talk podcast? Contact us here.
Sign up for our daily newsletter for 15 new cleantech stories a day. Or sign up for our weekly one on top stories of the week if daily is too frequent.
CleanTechnica uses affiliate links. See our policy here.
CleanTechnica's Comment Policy