floods

Road closed due to flooding in Colusa County, California, following an atmospheric river storm that delivered heavy rain and snow across Northern California. Photo taken on January 12, 2023. (Image credit: California Department of Water Resources)

How States Stack Up on Flood Disclosure

Growing Nationwide Trend of States Requiring Flood Disclosure Hundreds of thousands of Americans already live in homes that have flooded. And a home that has flooded once is likely to flood again. Unfortunately, far too many buyers and renters were never told whether their potential dream home was a flooding nightmare … [continued]

A flooded intersection in Flatbush, Brooklyn. By Wil540 art (CC BY-SA 4.0 license), via Wikimedia Commons.

NYC Gets Month’s Worth of Rain in Just Hours

New York City came to a standstill last week after intense rainfall caused flash flooding across much of the city. Almost 8 inches of rain fell on JFK Airport on Friday, the most rainfall in one day since record-keeping began in 1948, while CNN reports that Brooklyn got a month’s … [continued]

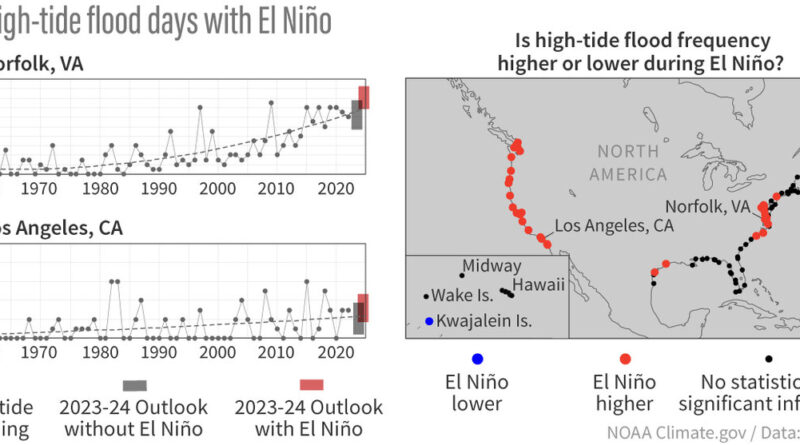
Side-by-side maps showing flood days due to seal level rise compared to days due to El Niño (Left) Graphs of number of high-tide flooding days per year (gray line and dots) from 1960 through 2022 from NOAA tide gauges in Norfolk, Virginia (top), and Los Angeles, California, (bottom). The gray dashed line shows the long-term increasing trend (note the accelerating trend in Norfolk). The gray shading at the end of the time series indicates the likely range of values that would be predicted for 2023-24 based solely on extrapolating the long-term trend. The red shading indicates the official 2023-2024 Hide-Tide Flooding Outlook, which provides the ‘likely range’ of high-tide flooding days over the course of the year. The higher number of predicted flood days in the official outlook relative to the extrapolated trend reflects the expected effects of the predicted moderate-to-strong El Niño through the upcoming winter. (Right panel) Locations where El Niño influences annual high-tide flooding frequencies. Black dots represent locations with no statistically significant influence. Note that the El Niño influence varies slightly both spatially and through time, but not much--see previous NOAA High Tide Flood Outlook reports (listed in footnote 3). NOAA Climate.gov image, adapted form original by Billy Sweet.

El Niño Means An Even Floodier Future Is On The Coastal Horizon

This is a guest post by Dr. William Sweet and colleagues Dr. Greg Dusek, Dr. John Callahan, Analise Keeney, and Karen Kavanaugh with NOAA’s National Ocean Service who are advancing the science and services to track and predict coastal flood risk in the face of sea level rise.

Undisclosed Flood Damage Financially Soaks Home Buyers

Across the United States, the majority of states lack laws that require flood damages be fully disclosed to home buyers. The consequences can be financially ruinous to those who unwittingly purchase a flood-prone home. States that don’t require disclosure of flood risks, or have inadequate disclosure requirements, hurt those with future flood … [continued]

Largely Unregulated Gas Pipelines = Huge Methane Pollution, Permian Ponzi Scheme — Nexus News Roundup

Largely Unregulated Gas Pipelines Huge Source of Methane Pollution The largest source of leaks of the potent greenhouse gas methane may be the spider web of largely unregulated pipes transporting it from drilling sites to processing facilities, according to new research from the Environmental Defense Fund. This 425,000-mile network network of pipes … [continued]