8 Charts Showing Tesla’s Fast Continued Sales Growth
Support CleanTechnica's work through a Substack subscription, on Patreon, or on Stripe. Help us produce all of the high-quality, original content we publish week after week despite the challenges of content-scraping AI, antisocial media, inflation, and other hurdles.
Tesla reported its 4th quarter 2022 vehicle production and delivery numbers this week, as well as providing the full-year 2022 figures. In covering the news, we published two charts of the overall numbers, but digging deeper as well as estimating the model-by-model split, we’ve now got 8+ charts to share and write about.
Long-Term Tesla Sales Trends
First, let’s run through the charts of Tesla’s overall sales trends.
![]()
You can see in this first bar chart that Tesla has seen almost unbroken quarterly sales growth for the past few years. Furthermore, in the last quarter, Q4 2022, Tesla surpassed 400,000 sales in a single quarter for the first time, a result which implies a production capacity of more than 1.6 million vehicles a year. What will Q1 2023 bring?
![]()
Looking at cumulative sales on a quarterly basis, you get a different view of Tesla’s meteoric rise. It’s almost a perfect growth curve of a disruptive technology or company. Going back to 2016 or 2017, it’s almost hard to believe what has happened. Indeed, back then, few of us believed Tesla would achieve this growth, which is close to what was forecast by Tesla back then. Much money was bet on Tesla crashing and burning instead. The big question now is whether this growth continues, as Elon Musk has forecast, or it levels off at last. Predictions, as expected, are all over the place. Take your own best guess.
Tesla Model Sales Growth — Tesla’s Breakdown
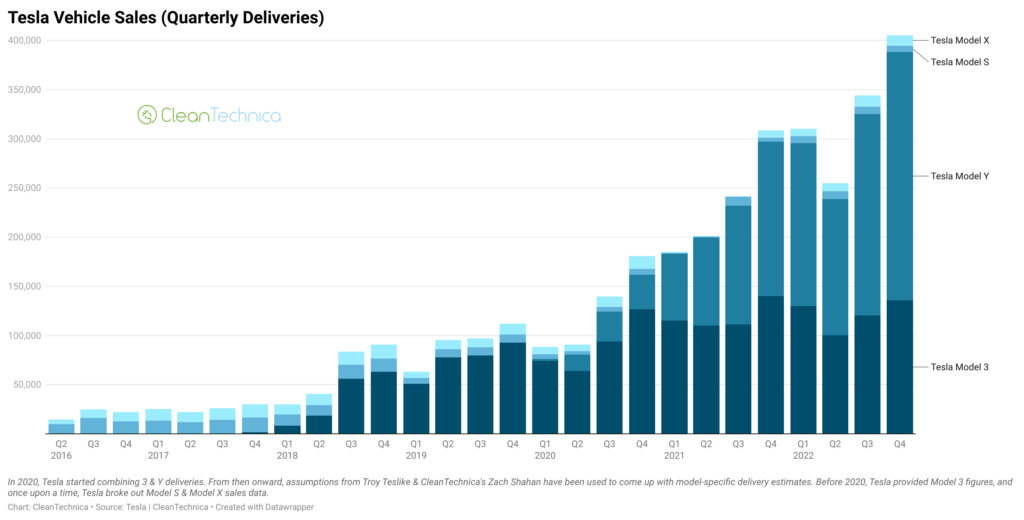
Tesla doesn’t exactly break out model-by-model production and sales stats. The company combines the Model 3 and Model Y and combines the Model S and Model X when reporting quarterly and annual statistics. Let’s look at a graph on these numbers before trying to dive deeper.
![]()
Naturally, as has been the story for years now, Model S and Model X sales are negligible compared to Tesla’s true mass-market models. The Model 3 and Model Y, meanwhile, have seen rapid, strong growth.
Tesla Model-By-Model Sales Trends, For Real
Most of us are much more interested in the Model 3 versus Model Y split than the Model 3/Y versus Model S/X split. Especially now that production is ramping up globally and Tesla is perhaps hitting more of a demand limit with the Model 3 while increasing Model Y production and deliveries, the split between the models becomes something of great interest to many Tesla followers.
Looking at registration data tracked by Jose Pontes in Europe, China, and globally, as well as Troy Teslike’s model estimates, I’ve come up with CleanTechnica‘s own estimate on the Q4 and 2022 global sales split by model. The remaining charts visualize those estimates over time.

Starting with this line graph, you get a different view of the Model Y & Model 3 meteoric rise that better shows the Model Y’s role or importance there. Model 3 sales have been more or less steady since the Model Y came to town, whereas the Model Y has shot up in the course of two short years.

The bar chart above shows that in a different way. You can see that the Model 3’s Q4 2022 was very similar to its Q4 2021, and its Q3 2022 was very similar to its Q3 2021 — well, you get the idea. The Model Y, however, is what led to the overall Tesla sales bars growing and growing.
These next three charts show cumulative sales growth of the Model 3 and Model Y, with the latter two charts using the same scale in order to allow for better comparison of the Model 3 and Model Y. Whereas Model 3 cumulative sales growth is straightforward and solid, Model Y cumulative sales growth looks almost exponential.


To see additional interactive model-by-model bar charts as well as interactive versions of the charts above, head on over to CleanTechnica Pro and sign in or become a Member, Supporter, Technician, or Ambassador (and then sign in).
Sign up for CleanTechnica's Weekly Substack for Zach and Scott's in-depth analyses and high level summaries, sign up for our daily newsletter, and follow us on Google News!
Have a tip for CleanTechnica? Want to advertise? Want to suggest a guest for our CleanTech Talk podcast? Contact us here.
Sign up for our daily newsletter for 15 new cleantech stories a day. Or sign up for our weekly one on top stories of the week if daily is too frequent.


CleanTechnica uses affiliate links. See our policy here.
CleanTechnica's Comment Policy