Global Shipping Less Of CO2e Problem Today Than Aviation, More By End Of Century
Support CleanTechnica's work through a Substack subscription or on Stripe.
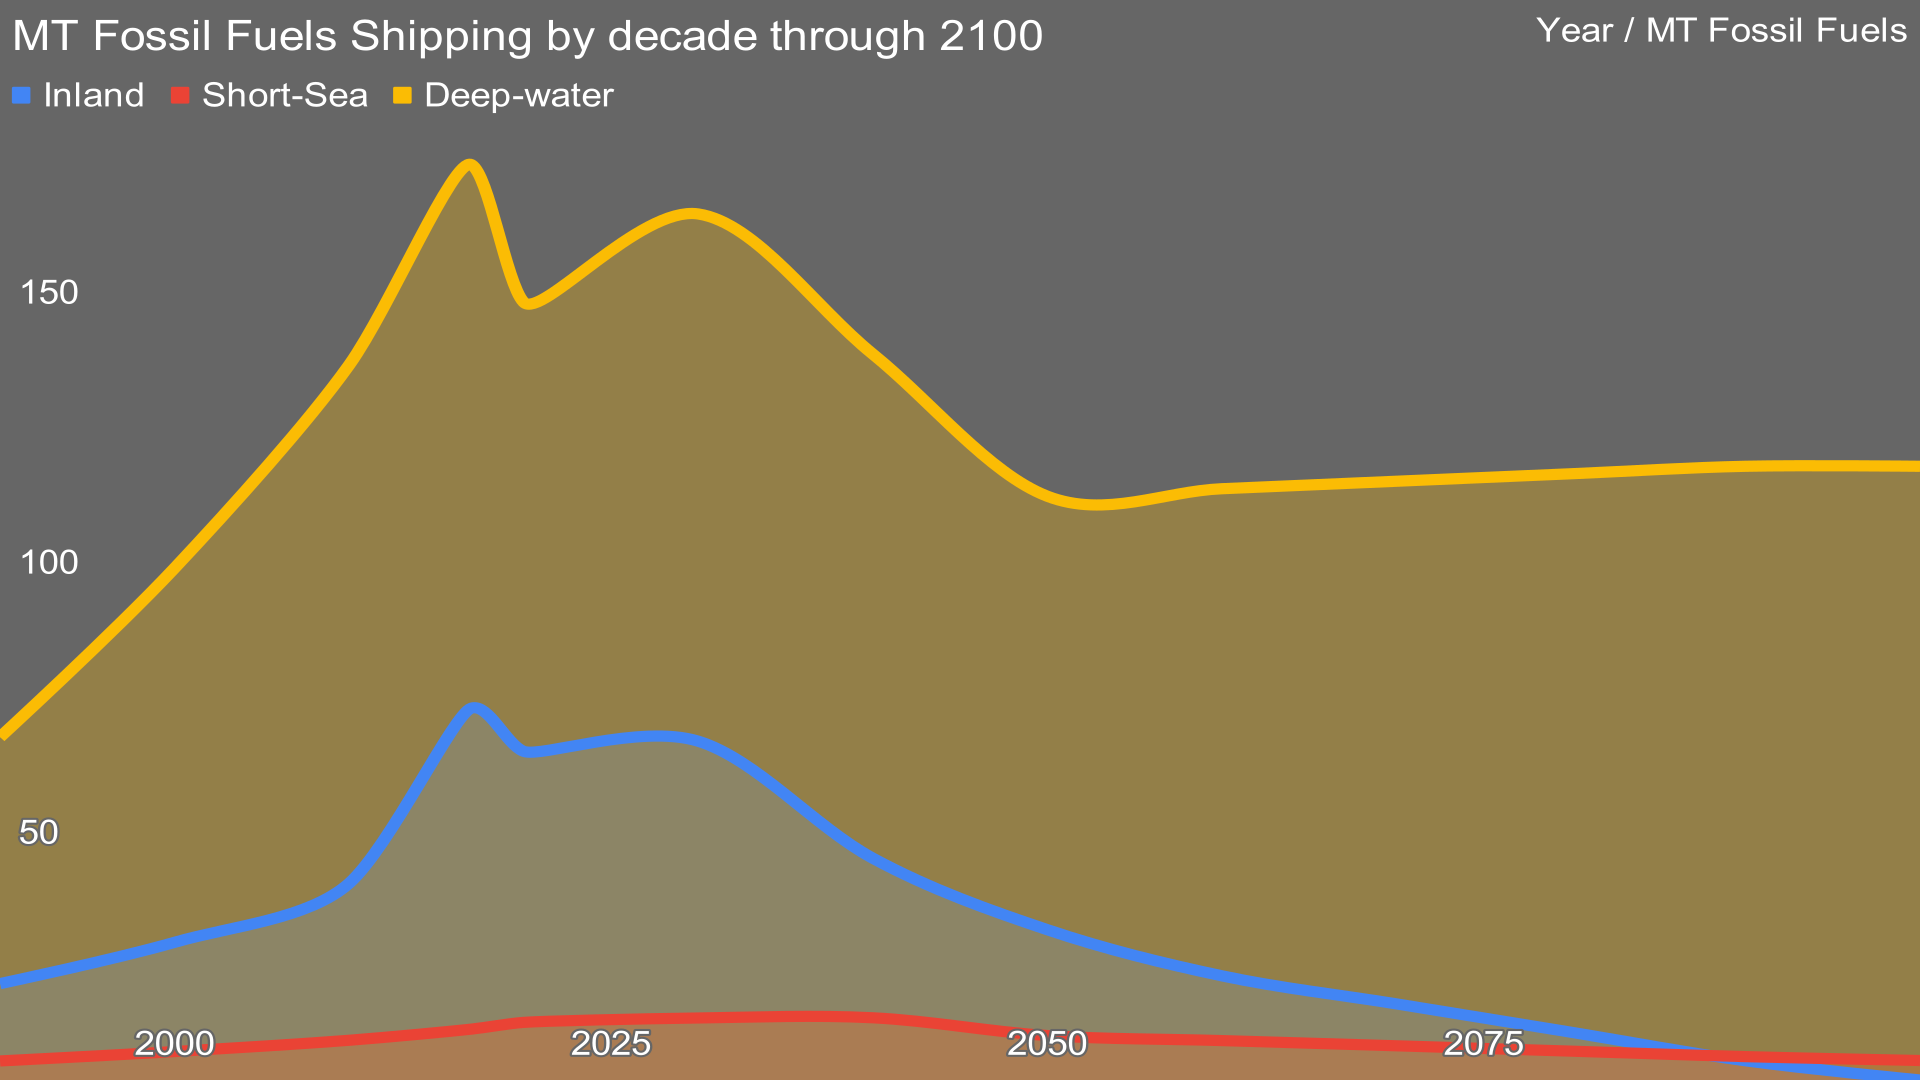
Global shipping, deep-water, short-sea and inland, is a major contributor to global warming emissions, calculated at roughly a billion tons of CO2e at peak before COVID. There are multiple trends and technologies which will diminish it, but while aviation will almost fully electrify by 2100 in my opinion, New Panamax-scale ships steaming between continents are a much harder target, burning tons of fuel daily.
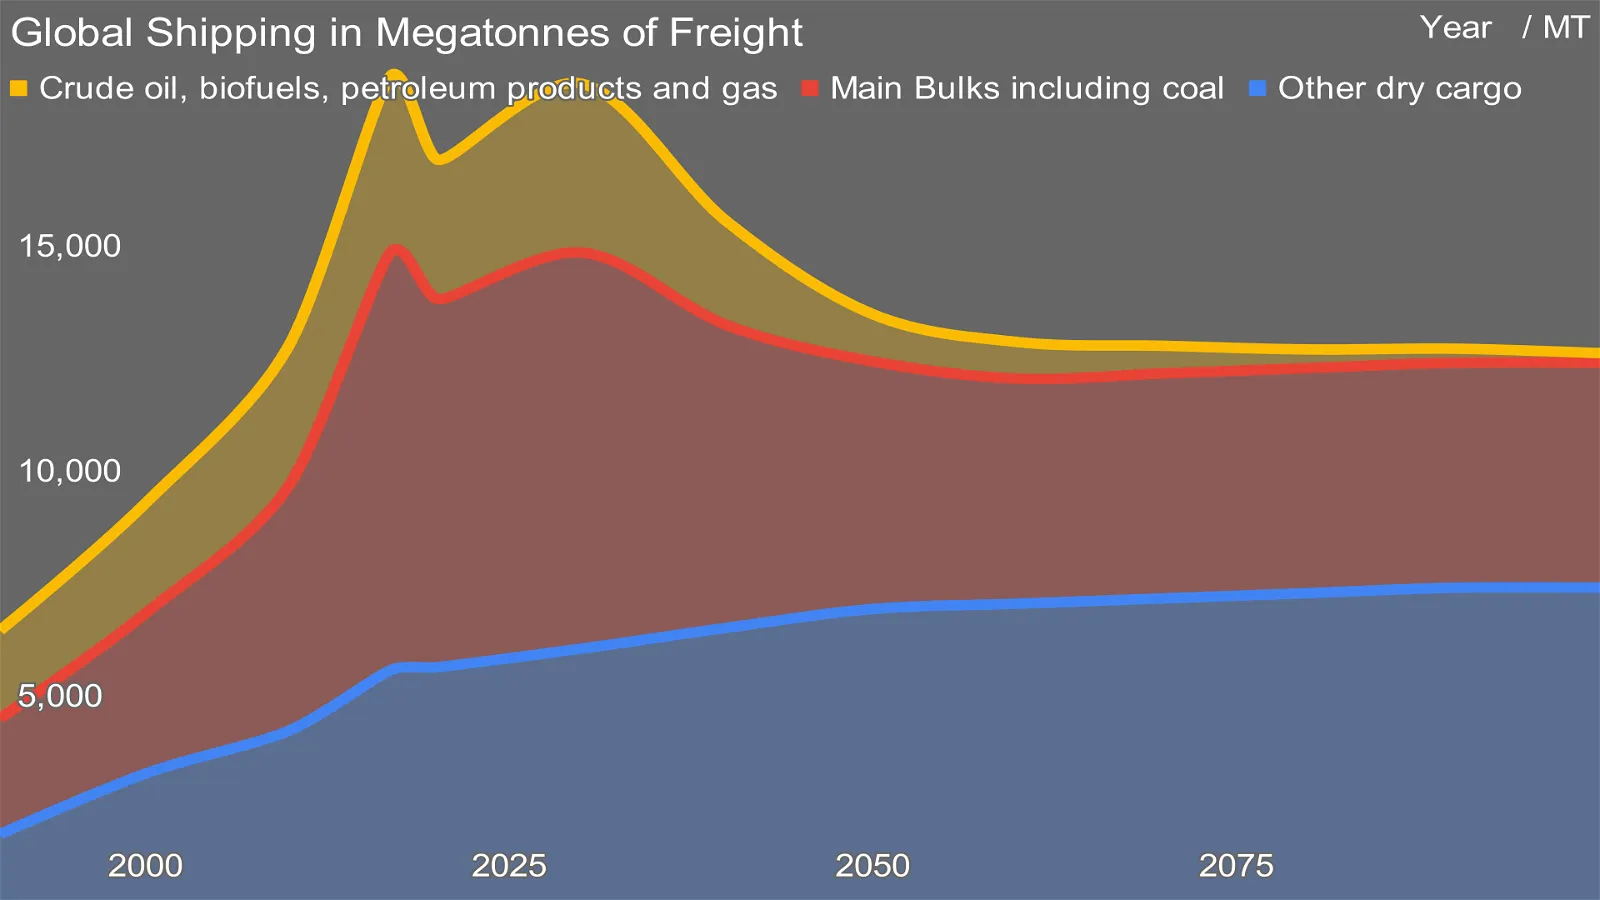
Last year I had started the analysis, looking only at salt-water shipping, both short-sea and deep water. It became clear then that 40% of salt-water shipping was for coal, oil, and gas, and those segments would plummet in demand. Further, another 15% was for raw iron ore, and with increases in costs of shipping as negative externalities are inevitably priced into the segment, more local processing will be performed, along with a lot of scrapped fossil fuel infrastructure being fed to electric steel minimills powered by renewable electricity. Shipping would shift to more finished goods and more containerization, population increases through 2070-2100 would drive some increases, and increasing wealth would drive some increases as well. However, growth is projected to be slow in my view, and the longest international shipping will not grow as rapidly as it shorter-haul modes due to fuel costs.
Standard proviso: I assemble the best data I have, look at multiple future forcing factors, and project out for decades, but it’s a projection to trigger discussion and thought, and to find rough magnitudes of scale. I’m not predicting the future, I’m creating a useful scenario of it to enable further discussions. Don’t assume I’m right, or that I think this is accurate, in other words.
When I returned to the analysis in March, the first thing I had to do was to create a single, normalized model for tonnage that included inland shipping, something the source I was using in December did not include. That was surprisingly difficult. There is one source which attempts to aggregate inland shipping from multiple sources for the entire globe, the Worldwide Inland Navigation Network. However, it is focused, it appears, on only river shipping, not inland lake shipping, based on the numbers I had, and the tonnage numbers for China specifically were obviously wrong. As such, I had to use other sources for Chinese inland shipping and Great Lakes shipping, the major outliers, and adjust for reasonableness and to avoid overlap. And the range of data was from 2006 to 2018, so further adjustments were required.
The lack of a single, credible source of global waterborne shipping tonnage, fuel use, and emissions, and the difficulty of finding the data and normalizing it surprised me. The transportation segment is in the 2% of global CO2e emissions range, yet it appears to be disaggregated. If anyone has a unified source, please let me know.
The second surprise was the scale of inland shipping. About 42% of all water-borne shipping tonnage annually is on rivers and lakes globally. I had expected the deep-water portion to be higher, as it gets most of the attention, but that turned out not to be the case.
The third surprise was the sheer scale of China’s inland water-borne shipping, something which I had sufficient data to not be surprised by, but had never thought about. Half of all inland shipping globally occurs in China. After all, this is the country that built a 2,500-kilometer-long canal system, including the 1,776 km-long Jing–Hang Grand Canal, starting over a 1,000 years ago, with the first canal lock system in the world constructed in 983 CE. And the Yangtze is bigger than the Mississippi, by most measures. It’s not like virtually every movie I’ve seen set in China hasn’t had cargo boats in it somewhere either, yet the sheer scale surprised me still.
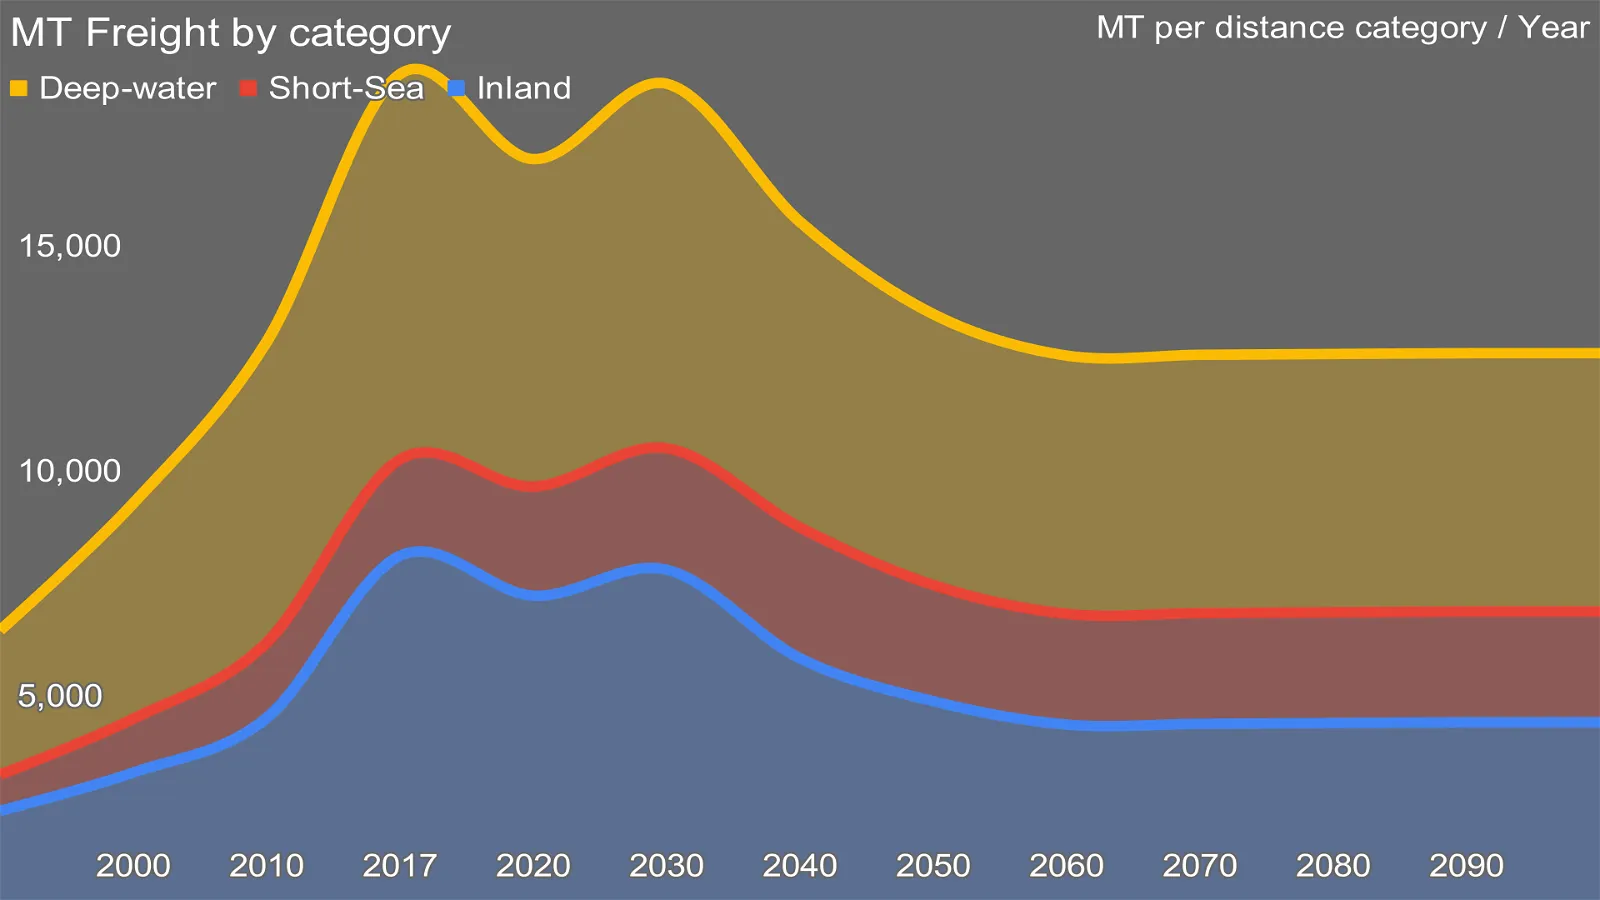
Finally, the confusion of short-sea shipping — coastal or small sea shipping between nearby-ish ports — vs inland shipping vs deep water shipping was somewhat challenging to disentangle. It was important, however, as riverine shipping is typically with much smaller craft than short-sea shipping (and Great Lakes Shipping), and similarly deep-water ships are immense by comparison. The tonnage separation is one I’ve created based on the data at hand, separating short-sea from deep-water shipping statistics, and is necessarily imperfect.
At present, I’m only somewhat comfortable with subset of deep-sea vs short-sea shipping I’ve created. I suspect that there is more coastal vs inland shipping than this analysis represents at this point in time. Once again, if someone has better sources and numbers, please let me know.
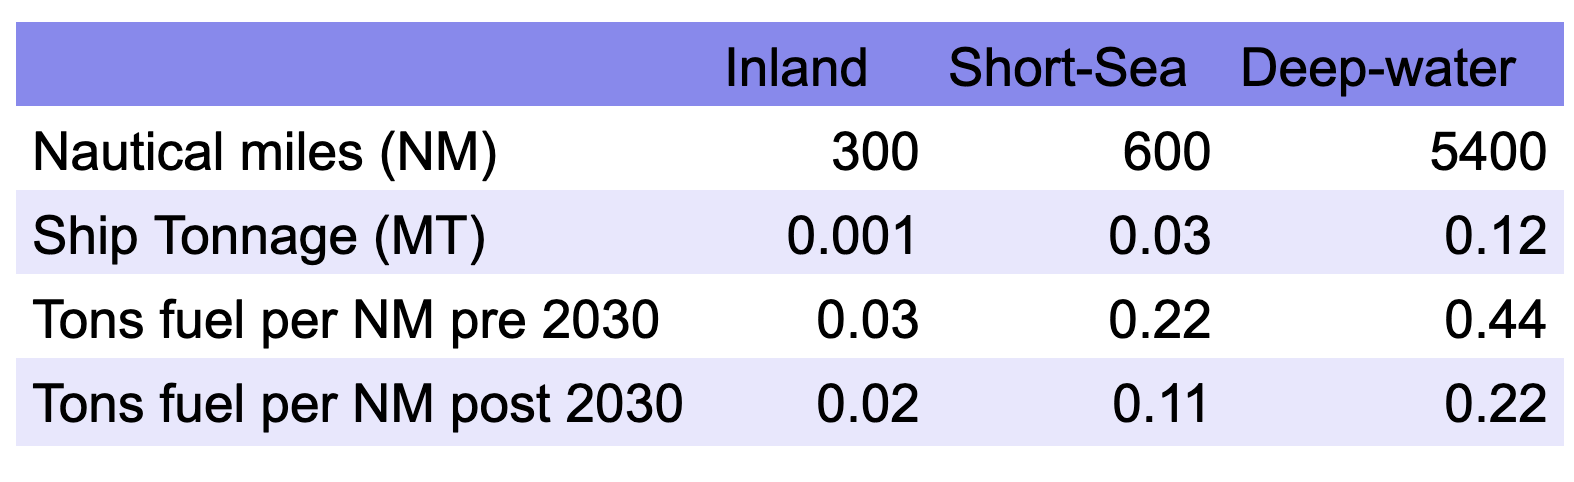
After that, of course, it was necessary to determine average tonnage, distance traveled, and efficiency for the three categories of ships. Once again, if someone has more robust numbers than the ones I assembled from multiple sources and adjusted up and down in a Bayesian pattern to find something that appears reasonable, please do let me know.
The efficiency variance pre- and post-2030 is interesting. I’ll be returning to this in more depth another time, but there are multiple technologies and operational changes which clearly make ships more efficient. The first is simply sailing more slowly. 19 knots vs 23 knots means a very big efficiency gain. I’ve also been looking at high-nose ships, post-screw vortex disruptors, and hydrosonic anti-fouling systems, all of which boost efficiency. Ships are getting slipperier and more efficient, and that’s aggregated into the efficiency gains which I’ve posited for significant penetration in a decade.
The next step was to project one key advance in marine refueling — electrification. Multiple vendors are already electrifying cargo ships, ferries, and the like, and since posting a version of the first chart on LinkedIn yesterday, two separate vendors of containerized battery systems for hybrid electric ships — a $3.4 billion new ship market today with strong growth — and custom-built fully electric ships were brought to my attention. When I spoke to a European inland ship manufacturer last year who reached out to me to consider whether Agora Energy Technology‘s CO2-based redox flow battery was fit for purpose for longer-haul shipping, we agreed that electrification would dominate, but he felt that there were some use cases where an alternative was required, especially in the transition period. And, of course, it’s likely not a coincidence that Tesla’s 3 MWh Megapack has dimensions and weight characteristics that are almost identical to a 20-foot equivalent unit container (TEU).
My projection is full electrification of inland shipping by 2100 and 2/3rds electrification of short-sea transport in the same time frame. After all, coastal shipping includes Cape Town to Cairo, and Argentina to Mexico. There are long routes and weeks at sea in the ‘short’ sea category.
At present, I have not done sufficient work to project what will replace the remaining liquid fuel component. There are certainly a lot of alternatives being promoted and considered, some of which I’ve assessed, and some of which I haven’t. These include synthetic or biomethane, biodiesel, ammonia, synthetic higher energy fuels like Agora’s CO2 model, and of course, hydrogen. A deep dive and opinion on that space is coming, but I needed to figure out the scale of the problem before it was viable to assess the alternative solutions for the hardest to decarbonize segment of shipping.

And so, the final chart. With just the readily available solutions of electrification where viable, and increased efficiencies across the board, in addition to the loss of demand from fossil fuels and raw iron ore, global shipping will see about 50% of the emissions in 2100 as it did at peak before COVID-19. Replacing bunker fuel with low-carbon alternatives is necessary for the rest. That roughly 500 MT CO2e, however, is still very significant, and has to be solved for. But that’s a coming assessment.
Sign up for CleanTechnica's Weekly Substack for Zach and Scott's in-depth analyses and high level summaries, sign up for our daily newsletter, and follow us on Google News!
Have a tip for CleanTechnica? Want to advertise? Want to suggest a guest for our CleanTech Talk podcast? Contact us here.
Sign up for our daily newsletter for 15 new cleantech stories a day. Or sign up for our weekly one on top stories of the week if daily is too frequent.
CleanTechnica uses affiliate links. See our policy here.
CleanTechnica's Comment Policy