

Waymo Gets Scientific: “Not All Miles Are Equal”
Support CleanTechnica's work through a Substack subscription, on Patreon, or on Stripe. Help us produce all of the high-quality, original content we publish week after week despite the challenges of content-scraping AI, antisocial media, inflation, and other hurdles.
Most of us would like to really know how much safer (or not) various robotaxis are than human drivers, and in particular how much safer (or not) they are than the human drivers they’re replacing. Tesla puts out these very generic safety statistics that are by and large useless because they are way too broad and comparing against far too generic of a data set, not to mention they don’t even tell us much detail about their own statistics. Waymo has been trying to take a more open, scientific approach — not that it’s been perfect either, but it’s been much better.
Now, the Alphabet-owned company has taken another step forward by publishing a blog post titled “Not All Miles are Equal: Why Time and Location Matter When Benchmarking Autonomous Safety.” Indeed — where driving occurs and at what time are critical for comparing and understanding statistics on this matter. (The age of the cars is also important, as Waymo/robotaxi vehicles should really be compared with newer vehicles that have better ADAS (advanced driver assistance systems), but I don’t see any word of Waymo doing that.)
Here’s how Waymo starts its article: “Not all miles are created equal. Navigating a highway commute on a Tuesday morning is fundamentally different from driving through downtown nightlife at 2:00 AM on a weekend. Our latest research — consisting of two new studies peer-reviewed and accepted for publication in the journal Traffic Injury Prevention — aims to close this gap by diving into two critical factors often overlooked in crash risk analysis: time and location.” Look at that: peer-reviewed research, stats that take important temporal and locational context into account, have to love it.
But that takes extra effort. Waymo has to find and use data that breaks down traffic volumes and crash data by time of day and by specific types of roads and locations. As someone who has a master’s degree in city and regional planning, I can tell you it’s much harder to find good data on that than on overall miles driven and broad crash data. However, it seems Waymo tracked it down for areas where it operates.
“At Waymo, we’ve long compared our safety record to human drivers using localized benchmarks. But a true apples-to-apples comparison that accounts for even more granular critical risk factors — such as time of day — is incredibly challenging. If an autonomous fleet drives heavily late at night in dense city centers, while the average human driver clocks most of their miles during daylight hours on routine, familiar routes, comparing blanket averages doesn’t give you the full picture.
“To enable a more accurate comparison, in both studies, our researchers paired human crash databases with granular traffic volume data to map exactly when and where humans drive. By unlocking the ability to break down human crash data by location and time, we’ve built unprecedented, highly precise benchmarks to evaluate Waymo’s performance against.”
Kudos to Waymo for doing this properly. (Again, it would be good if they also analyzed data by age and type of vehicle, but that is almost certainly not possible.)
“Evaluating autonomous vehicle safety requires moving past abstract, aggregated national averages. Meaningful safety assessment must be context-specific, accounting for the disparities in risk across different regions, infrastructure types, and times of day,” said Feng Guo, professor of statistics at Virginia Tech and lead data scientist for Virginia Tech Transportation Institute (VTTI). “This new research advances understanding of autonomous vehicle safety, by developing a framework to establish comparable human driver benchmarks that incorporate these critical spatial and temporal conditions.” Note that VTTI is a highly regarded research institute in this field. Feng Guo nails it. He does leave out the part I said about age of vehicle and available ADAS, but I presume that is again due to the fact that it’s just not practical for someone to conduct a study that goes into that depth at this point.
Okay, so, what did the research find? There’s no point in me trying to summarize and paraphrase what Waymo already summarized very well, so here’s the rest of the company’s blog post:
Where You Drive: The Fatal Crash Baseline
Risk varies wildly depending on exactly where you drive. Our research across the top 50 most populous U.S. urban areas, revealed a massive disparity in fatal crash involvement rates between different regions in the country.
For example, on surface streets human drivers in Memphis were involved in fatal crashes at a rate 8.4 times higher than drivers in Boston. Relying on a single national average to judge safety would be unfair in both cities — it overestimates the risk of driving in Boston by three times, while underestimating the hazards in Memphis by the same threefold margin.
Furthermore, the road type plays a major role: across all 50 regions, driving on surface streets carries a fatal crash rate 2.3 times higher than driving on freeways. This confirms a pattern identified in our previous research, which has consistently shown that urban streets present a higher crash risk than freeways.
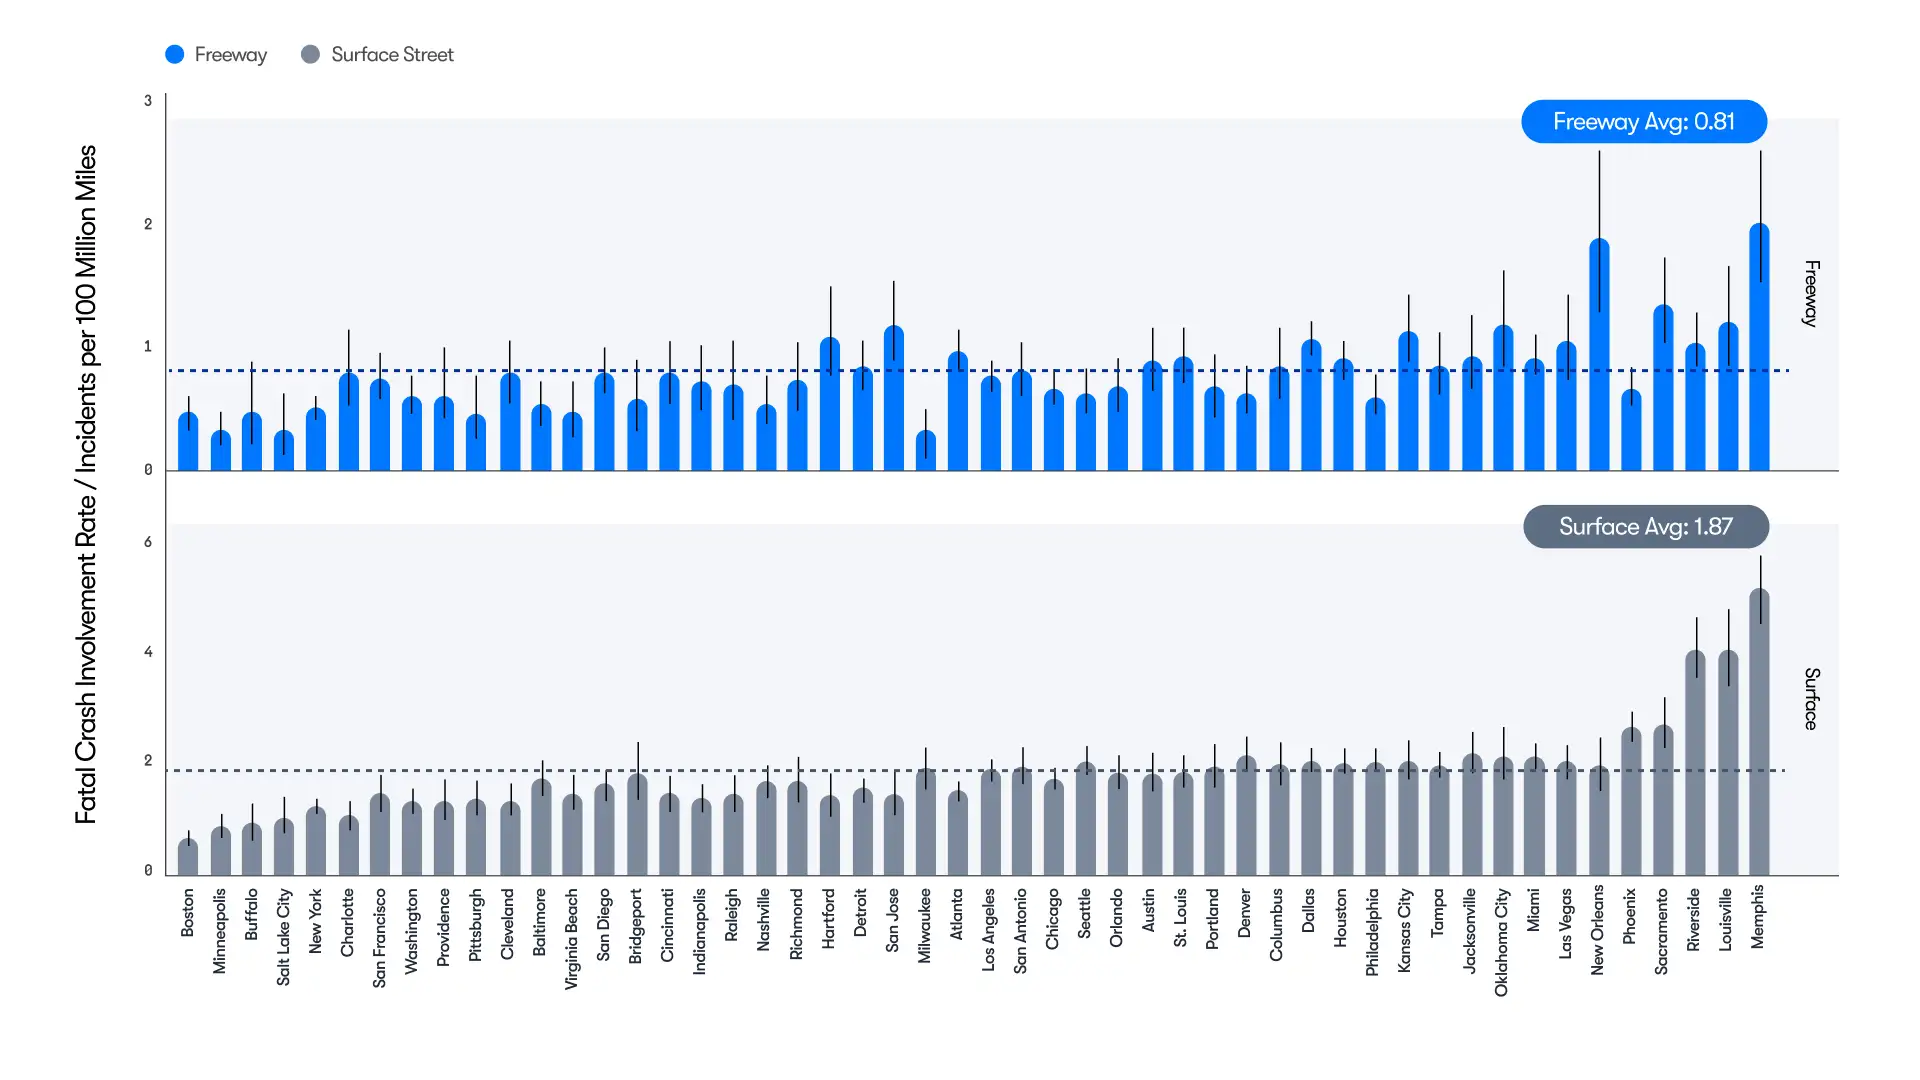
While we have accumulated the immense mileage required to show statistically significant reductions in serious injuries, fatal crashes are thankfully too rare to yield immediate, direct comparisons. As we work towards building scientific consensus, establishing these localized fatal crash baselines proactively will help create a clear framework to evaluate autonomous safety as the industry matures.
When Crash Risk Spikes
Risk doesn’t just change by the road type — it shifts by the hour. Our research shows that human fatal crash risk surges during late-night hours and weekends. Fatigue, darkness, and impaired driving completely change the safety landscape.

While urban areas set the macro baseline, our second study extends our prior geo-specific mapping work to include much more granular temporal factors: time of day and day of week across our major operational hubs — Maricopa County (Phoenix), San Francisco, Los Angeles, and Travis County (Austin). This allows us to measure Waymo’s performance against highly accurate, time-matched human benchmarks.
The data revealed that human crash rates spike drastically between midnight and 3:59 AM, particularly on weekends. Because overnight driving accounts for just 1.5% of total human mileage, these high-risk hours are completely masked in traditional crash data by the massive volume of safer daytime commuting. But look closer at that midnight to 4 AM window, and human crash rates surge to 2 to 5 times higher on weekdays, and 2.5 to 6 times higher on weekends compared to the general average. Pairing crash records with granular, hour-by-hour traffic-volume data lets us finally measure risk by the hour, not just count crashes.
“The data points to a significant increase in crash risk during late-night and weekend hours, when road safety is most unpredictable and impaired driving is most prevalent,” said Jonathan Adkins, Chief Executive Officer of the Governors Highway Safety Association (GHSA). “GHSA has long recognized the potential of autonomous technology to intervene when human decision-making is impaired, helping prevent behavior-related crashes and save lives.”
Waymo Improves Road Safety When It Matters Most
As a ride-hailing service, Waymo serves a high volume of riders late at night when nightlife peaks and alternative transportation is needed most. In fact, our fleet drives proportionally four times more miles overnight than the average human driver, placing our vehicles in the most hazardous driving windows.
Despite operating disproportionately more at night, the Waymo fleet achieved significantly lower crash rates across every single time window analyzed. Because crash risk is so much higher at night and on weekends, a substantial amount of Waymo’s safety benefit relative to the average human driver comes from these times.
When comparing the Waymo Driver’s real-world performance across 127 million autonomous miles (and regardless of fault) against a human driver navigating the same combination of locations, days of the week, and times of day, the study found that Waymo was involved in 359 fewer crashes with injuries. Crucially, 189 (or 53%) of those avoided crashes were during the overnight hours between 8:00 PM and 3:59 AM.
While our most recent Safety Impact Hub analysis features data from over 220 million miles, we believe the findings from this foundational study remain relevant and representative at our current scale.
Together, these papers illustrate the crucial importance of understanding location- and time-specific risk factors with regard to driving. By using dynamic benchmarks that account for spatial and temporal aspects, we can more accurately assess risk and measure the real-world safety impact of Waymo’s autonomous technology while honoring distinct complexities of each unique city. By sharing these findings and our underlying methodology, we hope to help the entire industry move toward a shared approach for evaluating safety—making roads safer for everyone, no matter the city, road, or time of day.
So, we are told what we know all too well — drunk drivers, drugged drivers, and sleepy drivers driving at night are more likely to be in crashes. It’s also unsurprising that Waymo robotaxis perform better in that critical overnight window, as they are not drunk, drugged, or sleepy. However, even beyond that, we find out that Waymo robotaxis are safer at all other times of the day. Are they safer than vehicles purchased within the last 5 years that have good ADAS? Well, we have no idea about that, but the data we have so far is clearly supportive of a shift toward autonomous driving at the level Waymo is offering.
At the end, of course, there is a call for others in the industry to be as open and rigorous in their statistical collection and analysis as Waymo. Good luck with that.
Sign up for CleanTechnica's Weekly Substack for Zach and Scott's in-depth analyses and high level summaries, sign up for our daily newsletter, and follow us on Google News!
Have a tip for CleanTechnica? Want to advertise? Want to suggest a guest for our CleanTech Talk podcast? Contact us here.
Sign up for our daily newsletter for 15 new cleantech stories a day. Or sign up for our weekly one on top stories of the week if daily is too frequent.

CleanTechnica uses affiliate links. See our policy here.
CleanTechnica's Comment Policy

