Tesla Master Plan Part III Is Published … & Misunderstood
Support CleanTechnica's work through a Substack subscription or on Stripe.
On the website of our our colleagues at Inside EVs, I encountered an article about Tesla Master Plan III. Thanks, Dan Mihalascu, I was not yet aware of the publication before that. But I am sorry to pop the bubble. The two pages you focus on are misinterpreted, just like they were on Teslarati and by some of my colleagues in our private chat channel.
Who is not confused about what is in this Master Plan Part III is our Zen Master Steve. He has written an excellent summary of the plan. But the most praise must go to the Tesla team for writing this Master Plan. It makes what is normally only written in eye-watering scientific articles that cause more headache than understanding into something that even this scientific noob can easily understand. It is worthy of reading by all of our readers. Use Steve’s article as a guide and perhaps this article to avoid some traps.
It is exceptional that a company uses an Investor Day not to talk about the climate in a greenwashing spiel, but actually confronts the audience with what is really happening and needed. Contrast this with any legacy car company or energy company. I called it nothing new (for CleanTechnica readers), but for much of the audience, it was likely shocking.
Master Plan Part III is only about the transition to renewable energy worldwide, with a special focus on the consequences of the transition for the transport sector. There is nothing specific about Tesla production or plans in it. Tesla’s representation of the numbers is confusing. It is only because I was researching the same numbers for an article I am working on that I could recognize them for what they were.


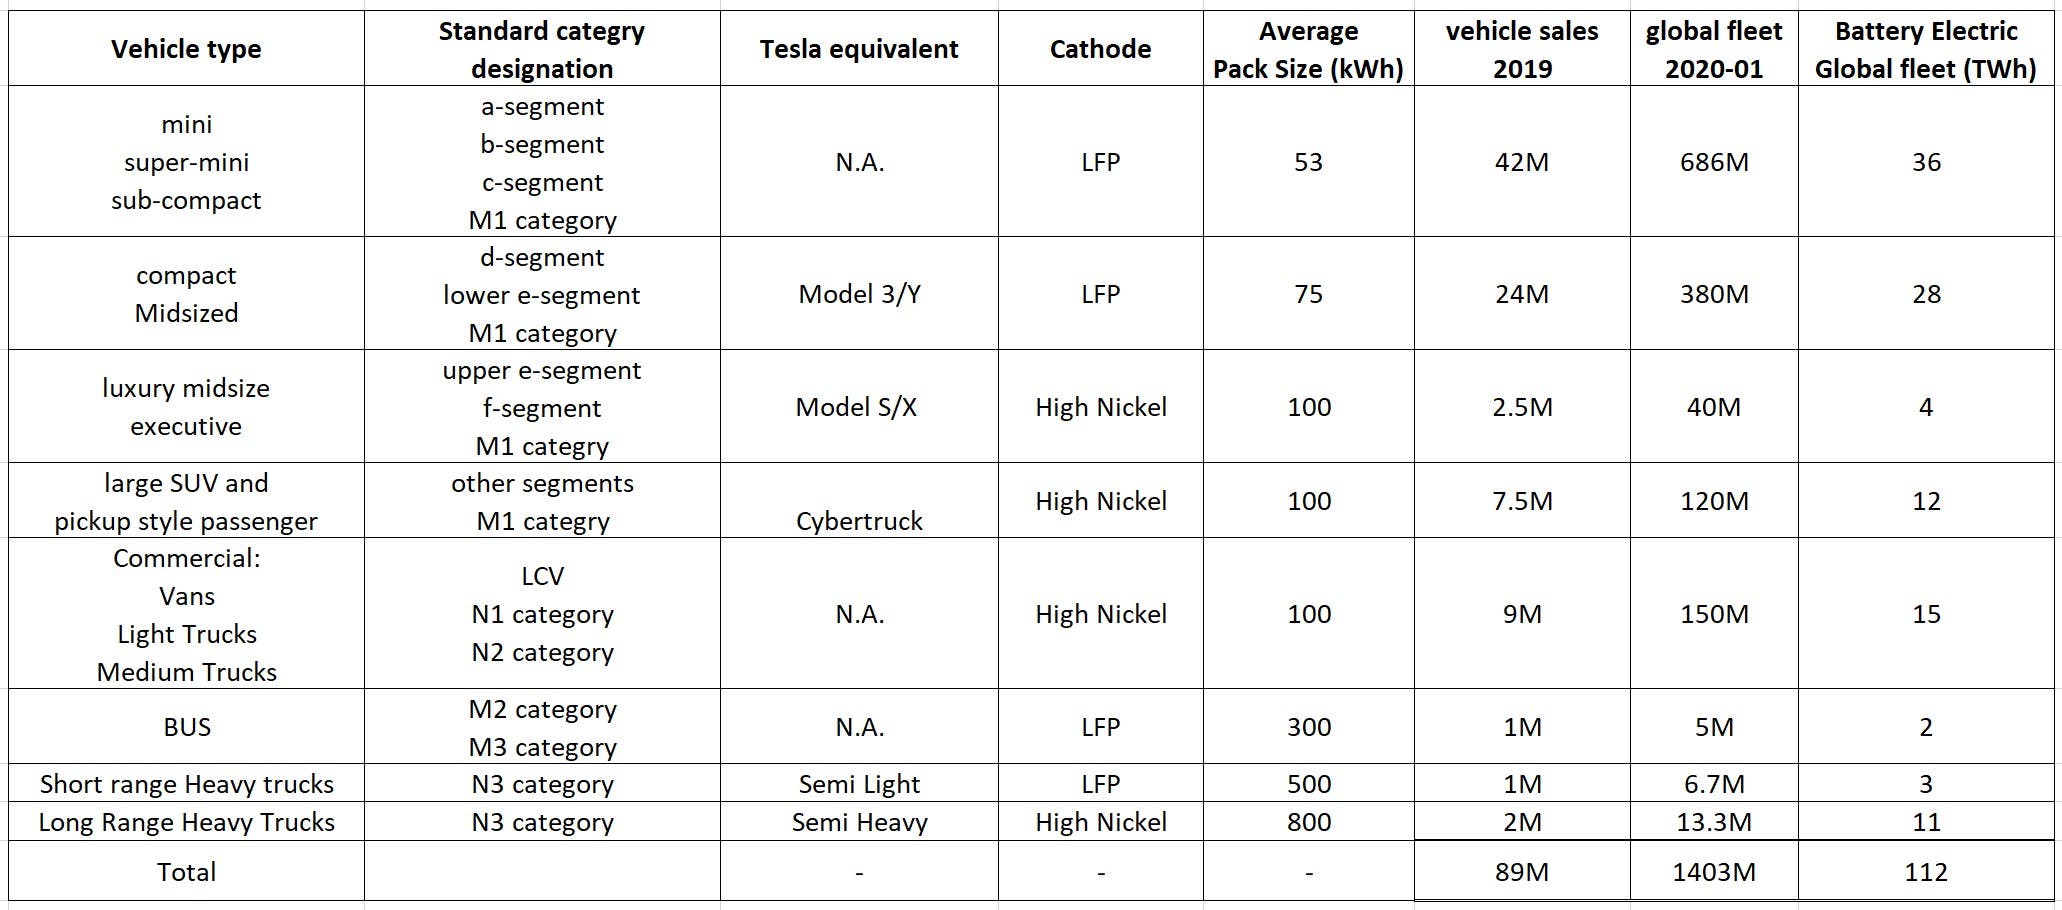
These are screenshots of the two confusing tables. For three of the categories in the first table, there is a [TBD]. “To Be Decided” means Tesla has not decided yet IF or WHEN it will make a vehicle in this category. The sole function of the column with Tesla-equivalent models is to tell the readers what the meaning of the category designations in the first column is, nothing more. It is just illustration.
The table is about the world vehicle market. The column “Vehicle Sales” is about the global sales in each category, likely in 2019. The column “Global Fleet” is about the number of vehicles of each category on the roads worldwide — 1,403 million is the number for 2020 in a report I saw. (But nobody really knows how many vehicles there are on the roads. It is an educated guess, and as such, 1.4B would be more accurate. Writing in four significant digits suggest an accuracy that does not exist.)
The “Cathode” column contains what Tesla thinks is the right choice for this vehicle category. The column with “Pack Size” is what Tesla thinks should be the average battery size in this category. Last but not least, we have the column “Global Fleet (TWh).” This is simply the pack size multiplied by the number of vehicles on the road. This is a very simplified worldview.
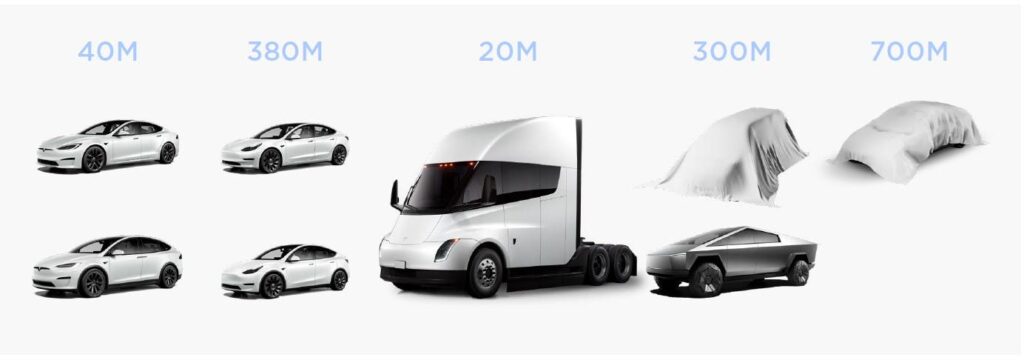
The second table, or perhaps better called an infographic, has the seven categories from the first table reduced to five. It omits the bus category, it consolidates short- and long-range heavy trucks, and it splits the large sedan category out from SUVs and trucks. Those SUVs and trucks have merged with commercial and passenger vans. Without knowing what should be there, it is nigh impossible to understand these two tables.
To clarify what Tesla tried to communicate, I have reworked the first table to something like what Tesla would have published is Tesla had a professional communications department.
There are two categories for vehicles with 4 or more wheels. The M category for passenger vehicles and the N category for cargo vehicles. Both have 3 subcategories. These are M1 (driver +8), M2 (driver + >8, max 5 tonnes mass), M3 (bigger buses), N1 (max mass 3.5 tonnes), N2 (>N1 and max mass 12 tonnes), N3 (>N2).
The M1 subcategory is comprised of nearly all the vehicle models on the road. It is further divided in segments. The most used segments are the a- to f- segments for normal cars, just getting bigger as they go. SUVs, sports cars, MPVs, and others have their own segment, but as they are becoming more normal on the road, these separate segments tend to merge into the main a-f segments.
Another thing that is very different from the way the vehicles are classified in the USA is these classifications are purely functional. A mini vehicle with an interior optimized for passenger transport is in the M1 category, but when the interior of the same vehicle is optimized for cargo, it is in N1. That means that SUVs and many pickups are not in the truck aisle but in the passenger aisle. An F-150 with 6 luxury seats and a smallish cargo bed is just a big luxury passenger car with an open trunk. But the USA market is less than 20% of the world market, and this is how most of the rest of the world looks at the automotive market.
Now it is clear that there is no hidden Tesla product development information in these tables. It is just a description of the automotive world as it currently is. And what is needed to make it all clean, renewable transport. As always, I have a little nagging to do about the numbers. The global fleet grows by about 40M each year. It will take about 25 years to get >95% fully electric. At that time, we need more batteries. But there are so many uncertainties in the next 25 years that I am completely fine with these numbers to make the task before us clear.
When reading the report, remember that some solutions in the report can be implemented in different ways. While working on the solutions, there will be new insights. Forty years ago, the expectation was that hydrogen fuel cells would power our cars. Twenty years ago, it was thought that carbon capture and sequestration (CCS) would be important to cleaning our energy generation. The hydrogen solution was made redundant by new battery technology, and CCS is the victim of PV and wind turbines getting cheaper and cheaper.
Personally, I have my doubts about some developments that others see as the main solution. You, my dear reader, can have these doubts too when reading the very accessible text of Tesla Master Plan III.
Sign up for CleanTechnica's Weekly Substack for Zach and Scott's in-depth analyses and high level summaries, sign up for our daily newsletter, and follow us on Google News!
Have a tip for CleanTechnica? Want to advertise? Want to suggest a guest for our CleanTech Talk podcast? Contact us here.
Sign up for our daily newsletter for 15 new cleantech stories a day. Or sign up for our weekly one on top stories of the week if daily is too frequent.
CleanTechnica uses affiliate links. See our policy here.
CleanTechnica's Comment Policy