Renewables In China Trend Upward While Nuclear Trends Flat
Support CleanTechnica's work through a Substack subscription or on Stripe.
I’ve been publishing assessments of the poor performance of nuclear compared to wind and solar in China for years (2014, 2019, 2021, 2022). My premise nine years ago was a first principles assertion with limited empirical results that wind and solar would radically outstrip nuclear in China. Why? Modularity reducing long-tailed risks, as Professor Bent Flyvbjerg, global expert and go to person for megaprojects, puts it in his new book How Big Things Get Done, where he includes my assessment of the natural experiment.

Subsequent assessments found that was true. Every year, the combination of wind and solar, and usually both individually, outstripped new nuclear generation, both in raw nameplate capacity and in additional TWh of annual generation. But as Professor Mark Z. Jacobson likes to remind us, it’s not WS, it’s WWS, that is wind, water, and solar. And so, today I spent a bit of time looking at hydroelectric generation capacity additions around the world since 2000, which turned out to be almost entirely in China. Of the 132.5 GW of new big hydroelectric projects connected to the grid in the world since 2000, 113 GW were in China. Unsurprising to anyone paying the slightest attention, but still, big numbers.
But what does that mean when added to wind and solar and compared to nuclear, leveraging the 2010 to 2022 data set I already had?

Massive hydro projects come online in spikes. I’ve split GW of nameplate capacity between initial connections to the grid and later connections when more turbines came on line. In the absence of other data, I’ve chosen to split them equally between the years in the data set I found. As a result, the massive Three Gorges Dam, which initially connected to the grid in 2008, and then added more capacity in 2012, shows up as a relatively small bump in this chart.
It’s unclear why, but 2014 saw seven hydro projects add grid connections totaling just over 40 GW of nameplate capacity. That was a banner year for hydro projects in the country, clearly, and an uncelebrated milestone in renewable generation.
But there is an interesting question about all forms of electrical generation, which is what capacity factors they are operating at. China’s wind and solar were historically curtailed by transmission connection challenges, which have been being resolved every year. Last year’s bumper crop of offshore wind, of course, were connected with HVDC to the grid without challenges.
What about hydro? It has different challenges for capacity factors, typically having a spring spate with often far too much water to use for generation, and a fall lull where generation is low. In the case of China, the best data I have at present is from the International Hydropower Association (IHA) which lists 1,355 TWh of electrical generation from 370,160 MW of capacity in 2020. That’s a 42% capacity factor, which I used for the generation.
I was somewhat surprised by this, and would be interested in better data, should anyone have some at hand. What it does mean is that while nuclear added a total of about 243 TWh of net new electrical generation from 2010 through 2022, hydro only added about 229 TWh of new generation. It was an interesting result which I’ll spend a little time assessing in a bit. Of course, wind energy added about 711 TWh of new generation annually over that period and solar added about 474 TWh. Both outstripped nuclear and hydro.
For purposes of wind, solar, and nuclear, I’d been simply presenting the new TWh of generation added each year. But in adding water to the data set, it seemed reasonable to make it cumulative.

The blue line at the bottom is nuclear, and not particularly sharp eyes will note that it’s trending to flat. The red line at the top is wind, water, and solar cumulative additions to annual TWh of electricity flowing into China’s grid, and not particularly sharp eyes will note it’s curving upwards.
Poking at the disparity between additions of actual TWh by renewable generation source a bit more, there are a few things to note.
The first, of course, is that wind and solar siting is much simpler than major hydroelectric siting. They just need flattish areas with good wind and sun, and wind likes ridge lines where flat bits can be made. Big hydro needs a big river with a reasonably significant drop along its length and at least one place where it’s carved a big valley. Meandering rivers like the Mississippi need not apply, although they are much better for inland shipping. The combination means that it’s typically easier to get materials and workers for wind and solar farms to the sites, easier to move construction vehicles around them and the like.
And hydroelectric reservoirs have another reality: you can’t live or work where they are. Unlike solar farms which can simply be built around existing buildings or roads, or wind farms where turbines can be built in the non-productive corners of farm fields, hydroelectric reservoirs displace everybody and everything where they exist. BC’s Site C Dam reservoir is going to be 93 square kilometers when filled, and everything and everybody in that space is displaced or submerged. Three Gorges is just over 1,000 square kilometers and 114 towns, 1,680 villages and 1.3 million people were displaced. Those are big areas and big issues to deal with.
Big dams are massive megaprojects in complex terrain. And this is where the next point comes in: fat-tailed risks.
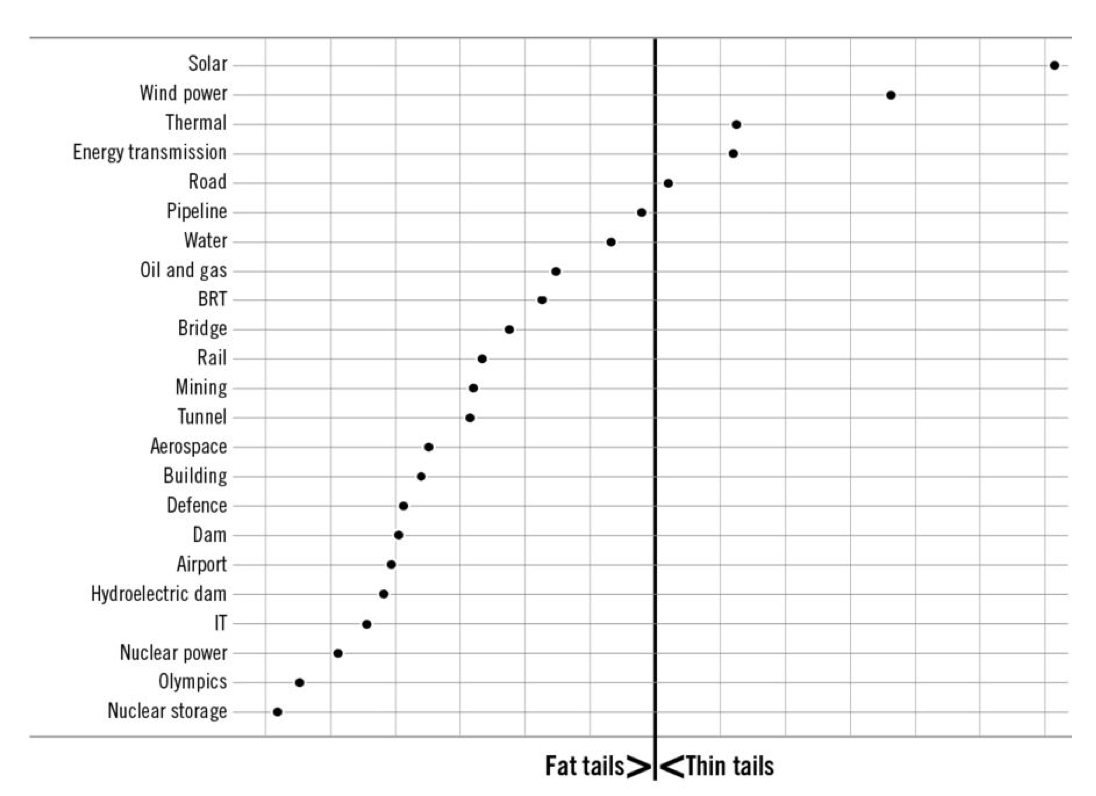
Yes, I’m using this graphic from Flyvbjerg’s book again. Track down the categories of projects until you find dams. Seventh from the bottom. 18th from the top. But still well above nuclear power plant construction. Major hydroelectric dams have lots of fat-tailed risks, per Flyvbjerg’s data. They have a strong tendency to run over budget, which is what this chart shows. Also over schedule.
Still, China has managed to construct and attach 16 of them to the grid since 2000. I was aware of the Three Gorges Dam, of course, but was unaware that it was a small portion of the hydroelectric China had constructed. And while each project’s cost and schedule results vs plans are unavailable, China did succeed in building them.
The natural experiment of renewables vs nuclear continues in China, and it continues to unfold in renewables’ favor.
Sign up for CleanTechnica's Weekly Substack for Zach and Scott's in-depth analyses and high level summaries, sign up for our daily newsletter, and follow us on Google News!
Have a tip for CleanTechnica? Want to advertise? Want to suggest a guest for our CleanTech Talk podcast? Contact us here.
Sign up for our daily newsletter for 15 new cleantech stories a day. Or sign up for our weekly one on top stories of the week if daily is too frequent.


CleanTechnica uses affiliate links. See our policy here.
CleanTechnica's Comment Policy