What’s Cleaner, An Electric Truck Or Plugin Hybrid Truck? It Depends…
Support CleanTechnica's work through a Substack subscription or on Stripe.
A while back, I read a very interesting article on The Drive estimating the lifetime emissions of electric pickup trucks. They concluded that electric trucks were still better than a comparable gas-powered truck, but that the point where the EV truck had saved enough energy to make up for the extra emissions of manufacturing a big honkin’ battery, a good chunk of the truck’s lifespan has already gone by. Worse, EV trucks are a lot dirtier than not only smaller EVs, but sometimes even the more efficient gas-powered cars until almost 200,000 miles.
One thing that impressed me about the article was their use of graphs to make the data very accessible to audiences. It’s one thing to be told something like, “Emissions don’t break even until several years in,” but it’s another thing to see the lines start at the emissions a vehicle begins with and watch how they take off at different angles and even pass each other.
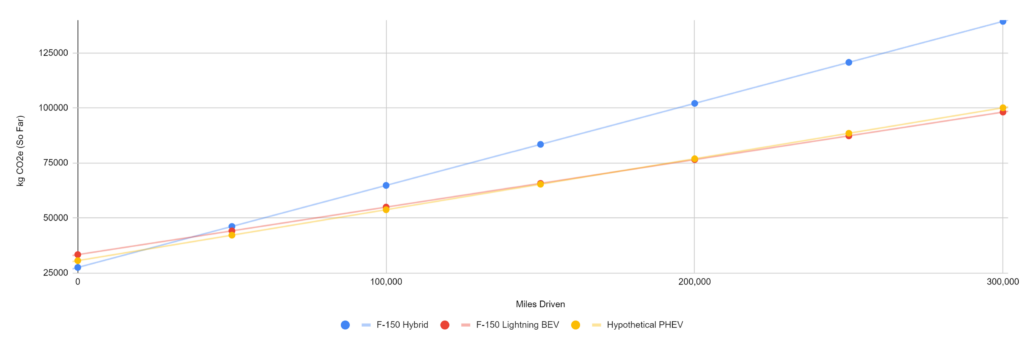
But, comparing a dirty ICE truck to an inefficient EV truck like the Hummer EV doesn’t tell us that much. I wanted to do the same thing the writers at The Drive did, but apply the method to comparable trucks with different drivetrains, and then put these trucks in different situations. To keep things as “apples to apples” as possible, I decided to compare the F-150 Hybrid, F-150 Lightning (BEV), and I created a hypothetical F-150 PHEV based on Hybrid and Lightning data. Hypothetical PHEV chassis weight is kept the same as the F-150 hybrid, then a 35 kWh battery value is used to give 60 miles of range plus some buffer room for durability. Increase in EV energy usage due to carrying around an ICE engine is NOT assumed because more battery weight was shed compared to Lightning than could have been gained with an aluminum EcoBoost V6 and transmission.
It took me a number of hours to gather the data and set up a spreadsheet to organize it all and, more importantly, create graphs to make the data presentable, and in this series of articles, I’m going to take a look at my findings.
Before I can do that, I want to be completely transparent so readers can not only check my math, but try different numbers for themselves if they think I didn’t do it right. If somebody can do a better job than me, I’d rather know about it see where I went wrong than let pride get in the way.
Here’s a link to the spreadsheet so you can examine it yourself. Below, I’ll explore the assumptions and methodology I used so you can make more sense of the spreadsheet and either trust me or tell me what I did wrong with this first effort.
Assumptions
I took several useful bits of data from the piece at The Drive I linked to at the beginning of this article. While studies have come up with different values for production emissions of vehicles and battery cells, the authors relied on the best data they could get from Polestar, and it fell near the middle of the range of figures that studies have shown, so they seem to be decent figures to run with.
The two key figures I reused from them were:
- 1,000 kg of CO2 emissions per 198 lb of chassis weight (everything but the battery, including any ICE parts). I reduced this to a per-pound figure for easier processing (1000 kg/198 lb=5.05 kg CO2e/lb)
- 98 kg CO2 to produce each kWh of battery on average (studies vary on this from 39 to 196 kg of CO2 per kWh of battery, so feel free to plug these figures into the spreadsheet yourself)
Calculating Emissions Per Mile
Figuring out how much emissions occurred when producing a vehicle is only the first step (and, sadly, one that anti-EV propagandists tend to stop at). To understand whether a vehicle is truly better for CO2 emissions, you have to look at the entire lifecycle of the vehicle. A vehicle can start with higher emissions and still win because it produces less emissions per mile. Eventually, the total emissions of the ICE or hybrid usually pass that of the EV, and it’s all advantage from there.
But, to get that figure, you have to take available data like MPG ratings, typical miles/kWh used, etc., and translate those to kilograms of CO2. Fortunately, the EPA makes that super easy with an online conversion tool based on their estimations. This was then plugged into the spreadsheet.
To create a hypothetical PHEV, I assumed 90% Lightning emissions and 10% Hybrid emissions for every mile. I know many EV fans assume that people don’t plug PHEVs in, but that usually comes from flawed studies based on usage by employees in company fleets where gas was paid for but the employee couldn’t be reimbursed for home electricity. For normal owners, people who paid extra for a plugin hybrid and have to pay for their own gas, manufacturer telematics data shows that people tend to actually plug that in. Further details on this will be available at a later date once these findings that were shared with me ahead of time are officially released.
If you can’t accept that, feel free to dig up your own data and plug it into the spreadsheet, and let us know about it. No “trust me bro” required.
Adding Towing & Home Solar Into The Mix
In other tabs, I decided to see what it looked like if people used home solar instead of grid charging and see what it looked like if the truck owner spent 10% of their time towing.
For solar, NREL estimates 40g of CO2e per kWh produced for the life of the average photovoltaic system. That’s .04 kg per kWh, which is really easy to plug into the spreadsheet in place of the EPA figures for average emissions using a kWh of energy. So, I did that.
Some studies put this number lower than 40g/kWh, but I chose the higher number to give fossil fuels the benefit of the doubt and they still lose by a LOT. If you want to see what lower figures you can find do to the graphs, feel free to do it yourself.
For towing, I assumed that time spent doing that would produce double emissions, which was pretty easy to put into the formulas on the sheets with a simple “*2” next to the relevant 10% figure. If you’re handy with Google Sheets, you’ll see what I mean. If not, feel free to trust me on this.
In Part 2, I’m going to use the methods described in this article to give readers some data! In subsequent parts, I’ll massage the data from the spreadsheet to put our virtual trucks in different situations, like charging with solar at home 90% of the time, towing, and both.
All chart images provided by Jennifer Sensiba.
Sign up for CleanTechnica's Weekly Substack for Zach and Scott's in-depth analyses and high level summaries, sign up for our daily newsletter, and follow us on Google News!
Have a tip for CleanTechnica? Want to advertise? Want to suggest a guest for our CleanTech Talk podcast? Contact us here.
Sign up for our daily newsletter for 15 new cleantech stories a day. Or sign up for our weekly one on top stories of the week if daily is too frequent.
CleanTechnica uses affiliate links. See our policy here.
CleanTechnica's Comment Policy