Oregon Nears Launch Of A Solid Community Solar Program
Support CleanTechnica's work through a Substack subscription, on Patreon, or on Stripe. Help us produce all of the high-quality, original content we publish week after week despite the challenges of content-scraping AI, antisocial media, inflation, and other hurdles.
Originally published at ilsr.org.
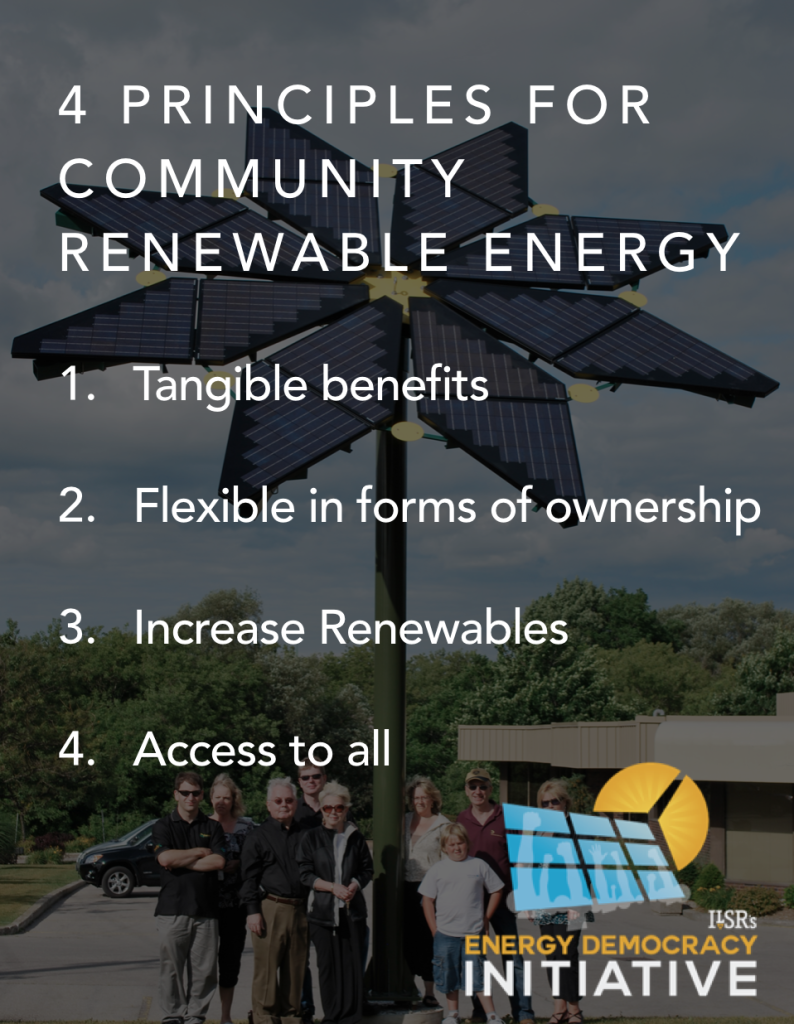
Adopted by the legislature in 2016, it’s been a long wait for Oregon’s community solar program to launch. Technically, it hasn’t yet, but the program rules are final enough to show that this program scores well on the four principles for community renewable energy.
December 16, 2019: post was updated to reflect the elimination of the inflation indexing component of community solar compensation in Oregon, as well as to clarify some of the low-income qualifications.
Tangible Benefits
The program’s compensation rates should result in financial savings for participants, with the rates guaranteed for 20 years. Pegged initially to the retail electricity rate, the compensation rate will rise by 2.18% per year over 20 years.

The inflation rate may end up being slower than electricity price inflation, which in Oregon has been running just over 3% since 1990, and around 2.7% since 2010, according to the Energy Information Administration.
For comparison, Minnesota’s original compensation rate was called the “applicable retail rate” –– around $0.12 per kilowatt-hour for a residential subscriber –– but included an adder of $0.02 per kilowatt-hour in the form of a renewable energy credit price. In subsequent years, however, Minnesota’s program has been amended to use the state’s value of solar price. The chart below shows the contract price (secured for 25 years) based on the vintage of the community solar project. Early indications are that the 2020 vintage value of solar will be between $0.11 and $0.12 per kilowatt-hour.

Maryland’s community solar compensation policy is similar to Oregon’s, with net metering credits provided for 25 years of production.
Flexible Ownership Forms
Like the successful programs in Colorado and Minnesota, Oregon also allows for a variety of ownership structures. The program allows for utility and non-utility owned projects, but also sets aside about one-quarter of the program capacity for projects that are government or nonprofit owned, or smaller than 360 kilowatts. This is an important element for a program that’s capped at around 160 megawatts of capacity. In Minnesota, almost no community solar projects have been built at a scale smaller than the maximum 1 megawatt (indeed, in the first two years, many project developers tried to co-locate five to twenty projects to capture economies of scale, sparking a utility revolt). With no program cap, the participation of commercial customers hasn’t detracted from the opportunity for residential subscribers, but in a capped program larger, private customers could quickly swamp capacity available to government, nonprofit, or residential participants.
The program rules also try to maintain a diversity of owners and participants, restricting ownership by a single entity as well as by individual subscribers. On the subscriber side, the program has similar limits to other states. Each subscriber is limited to no more than their annual usage and no more than 40% of an individual project. A subscriber is also limited to a total of 2 megawatts of subscriptions across the entire program.
The following table shows subscriber limits for three other programs compared to Oregon’s near-final rules.
| Oregon | Minnesota | Colorado | Maryland | |
| Percent of subscriber’s consumption | 100% | 120% | 120% | 200% |
| Max. percent of 1 solar garden by 1 subscriber | 40% | 40% | 50% | 60% (by subscribers with > 200 kW |
Increase Renewables
Unlike Minnesota’s uncapped program, the Oregon program is capped at approximately 160 megawatts in the “initial tier.” While this limits the total number of projects, the program is more flexible about individual project size, allowing projects from 25 kilowatts (a size that would cover a local hardware store) up to 3 megawatts (enough to cover three Walmarts).

For comparison, Portland General Electric –– serving just under half of Oregon’s population –– has a peak summer demand of approximately 4,000 megawatts. Oregon’s initial community solar tier would be about 4% of that utility’s peak demand, or about 1.8% of the statewide peak. Maryland’s program represents about 1.5% of peak demand. In Minnesota, existing community solar projects already provide close to 7% of Xcel Energy’s summer peak demand of over 9,000 megawatts (about 3.5% of the statewide peak electricity demand). In Colorado, Xcel Energy’s summer peak was 6,250 MW in 2014; with 51 MW of community solar, those projects supply 0.8% of peak demand.
Access to All
Oregon’s program has several provisions to encourage a diversity of program participants. Of the 160 megawatt initial program capacity, half is set aside for residential or small commercial participants. This is in contrast to Minnesota, where the lack of internal limits has meant close to 90% of program capacity is occupied by larger commercial participants (however, the lack of a program cap also means it hasn’t crowded out residential participation, which now counts over 12,000 subscribers).
Of the capacity designated for residential or small commercial, 10 percent of capacity is set aside for low-income subscribers (80% of state median income by household size), including customers with a utility allowance or rental assistance, or residing in an affordable housing development. A further 10% of capacity is set aside for low-income subscribers, defined as customers with a utility allowance or rental assistance, or residing in an affordable housing development. The program has some fairly specific guidelines for how to make subscriptions affordable. In the case of affordable housing, 75% of the financial benefits must pass through to tenants. For individual subscriptions, developers must offer at least a 20% discount. Those that offer a discount as high as 50% will get preference for allocation of low-income customers by the program administrator queue priority.
Summary
Oregon’s community solar program represents an exciting and long-awaited addition to the the field of community solar programs nationwide. On most fronts –– financial benefits, ownership, and access –– it scores very high. But the program should be allowed to grow beyond the initial allocation of 1.8% of peak demand. Already, Minnesota has demonstrated that community solar can meet a higher portion of summer peak energy demand and that there’s consumer demand for the program.
Conclusion: 3.5 out of 4
Other resources
- Report: Beyond Sharing – How Communities Can Take Ownership of Renewable Power
- Maryland community solar report from MD SUN
- Vote Solar: Colo. modernizes its community solar program
This article originally posted at ilsr.org. For timely updates, follow John Farrell on Twitter, our energy work on Facebook, or sign up to get the Energy Democracy weekly update.
Sign up for CleanTechnica's Weekly Substack for Zach and Scott's in-depth analyses and high level summaries, sign up for our daily newsletter, and follow us on Google News!
Have a tip for CleanTechnica? Want to advertise? Want to suggest a guest for our CleanTech Talk podcast? Contact us here.
Sign up for our daily newsletter for 15 new cleantech stories a day. Or sign up for our weekly one on top stories of the week if daily is too frequent.


CleanTechnica uses affiliate links. See our policy here.
CleanTechnica's Comment Policy