Do Solar Salespeople Oversell Savings?
Originally posted at ilsr.org.
For home or business owners considering solar, their solar developer predicts how much electricity the system will produce and how much the cost of electricity will increase over the years. Just how accurate are these predictions of rooftop solar savings?
Solar installers do better than utilities do at predicting growth in electricity sales, but there’s room for improvement. ILSR examined quotes from two solar developers that are indicative of the industry and matched them against actual electricity prices.
To be fair, market electricity prices are difficult to model. Electricity from solar can be given a set price over the lifetime of the solar project, but the overall market rate for electricity is dependent upon many factors. The construction and retirement of power plants, utility infrastructure plans, demand for electricity, and fluctuating fuel prices all create uncertainty. The following chart of gas prices over time gives a sense of the challenge.
Historical Natural Gas Prices

Despite the challenges, solar still generates savings and the industry is booming. In California, where electricity prices are high, rooftop solar has taken off — see ILSR’s 2018 visualization of this market’s growth. People outside of the sunny Southwest are installing solar, too. The analysis below looks at eight states where individuals are seeing success with rooftop solar: Arizona, California, Florida, Massachusetts, Minnesota, Nevada, New Jersey, and North Carolina.

Predicting Future Energy Costs
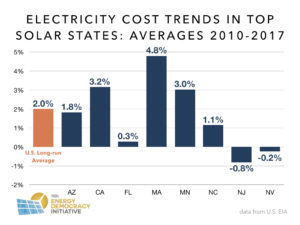
The long-run national average of electricity price inflation is 2% per year, but it is much more volatile by region:


These charts hint at the difficulty of modeling these prices. In Arizona, California, and Minnesota, electricity prices have been rising at a fairly steady rate. However, in the rest of the modeled states, prices have both increased and decreased year to year. In New Jersey, solar developers would miss the mark if they predicted any change in prices at all. The following chart compiles the average annual change in electricity cost in our states of interest, from 2010 to 2017:
A Deeper Look at Solar Developer Quotes
ILSR came across two recent estimates of how electricity prices will change from solar developers in California and Minnesota (and found them similar to estimates from quotes received several years ago). Given their estimates and how prices have actually changed, did developers overestimate the potential savings — and underestimate the payback period — of residential solar?
The figures below model a five kilowatt system installed in the year 2015, in both California and Minnesota. They assume a $4 per watt installation cost, a 20 year life to the system, and a 30% tax credit. System output for rooftop solar in California and Minnesota is predicted using the conditions of Sacramento, Calif., and Minneapolis, Minn., respectively.
At an installation cost of $4 per watt, the total cost is $20,000. With the 30% federal tax credit, customers seek payback on their $14,000 investment. Given electricity prices and system output, how long will the payback period be for each residential owner?
If this type of investment sounds expensive, read about the benefits of community solar (with much lower upfront costs) in the 2016 report Beyond Sharing, also from the Institute for Local Self-Reliance.
First, individuals deciding to install rooftop solar are going to see payoff. Since the lifetime of a solar array is at least twenty years — per the manufacturer’s warranty — solar in every state is sure to pay back its initial cost. Plus, with state and utility incentives, the payback period could be even shorter.
Here are the payback periods for some of the top solar states, with only the federal 30% tax credit and value of electricity generated:
| State | Payback Period Length* |
| Arizona | 13 years |
| California | 10 years |
| Florida | 17 years |
| Massachusetts | 10 years |
| Minnesota | 15 years |
| Nevada | 15 years |
| New Jersey | 16 years |
| North Carolina | 18 years |
*length does not include any state or utility incentives
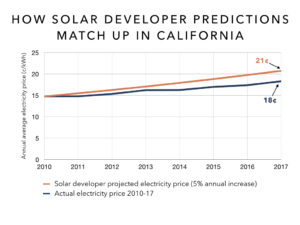
One rooftop solar customer in California was given a quote by their developer that electricity prices would rise by 5% per year. The following chart compares that with actual prices over the past seven years. The developer was nearly 15% too high by the end of seven years, compared to the actual price inflation of 3.5%.
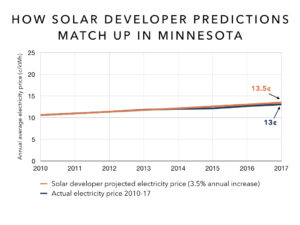
In Minnesota, the 3.5% electricity price growth rate quoted by a solar developer has been close to the actual rate. The resulting price is only off by half a cent after seven years.
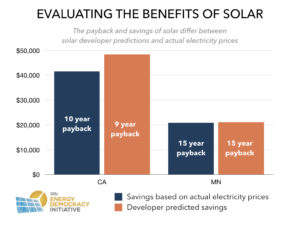
In each example, the developer quoted rate resulted in a price that was higher than the actual. This means that the developer underestimated the system payback period and overestimated the customer’s total savings — but by how much?
In the California example, the predicted payback period would be shortened by one year and the 20 year savings inflated by $6,880. For Minnesota, the developer would have accurately predicted the payback year, but overestimated the savings 20 years after installation by $756.
In both of these cases, developer estimates have not been conservative enough to match actual prices, either over the past seven years or the prior twenty. On the one hand, predicting higher electricity cost increases may lead to more sales by inflating projected savings. On the other hand, even at the lower actual prices, customers will see a handsome payback. But it presents a challenging conflict of interest for solar salespeople. The following chart illustrates how two representative price forecasts would fare over the 20 years in each state examined, compared against actual prices from the last seven years (and extended out at the 7-year rate).
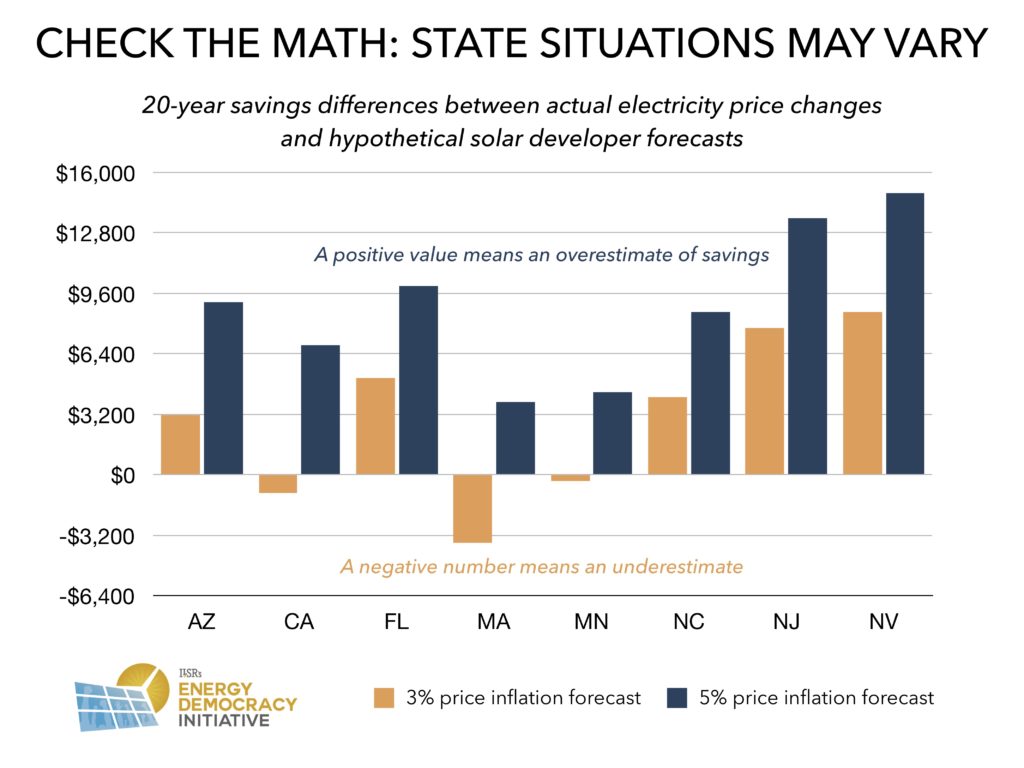
Forecast prices matter. A 5% electricity price inflation forecast would have overstated 20-year savings by at least $3,000 in every state. In Nevada, on the high end, it would have overstated savings by nearly $15,000, 60% higher than if electricity prices maintain recent trends. A more modest forecast of 3% inflation, on the other hand, would understate savings in nearly as many cases as it overstates them. In the cases where it was off, it’s in states with abnormally stagnant prices.
Listen to this episode of Local Energy Rules with Vikram Aggarwal of EnergySage for more on what consumers should look out for when shopping for solar.
Rooftop solar provides a great opportunity for electricity customers to cut their bills, but solar shoppers should ask careful questions about the projections of savings. Predicting electricity prices is hard, but solar developers are using a wide range of guesses. Being off by a lot can significantly change the expected savings from solar.
Does solar save money? Yes. But how much is a complicated question.
This article originally posted at ilsr.org. For timely updates, follow John Farrell on Twitter or get the Energy Democracy weekly update.
Have a tip for CleanTechnica? Want to advertise? Want to suggest a guest for our CleanTech Talk podcast? Contact us here.
Latest CleanTechnica.TV Video

CleanTechnica uses affiliate links. See our policy here.