Graph Of The Day: How Wind Energy Trumped Liddell In September
Support CleanTechnica's work through a Substack subscription, on Patreon, or on Stripe. Help us produce all of the high-quality, original content we publish week after week despite the challenges of content-scraping AI, antisocial media, inflation, and other hurdles.
Originally published on RenewEconomy
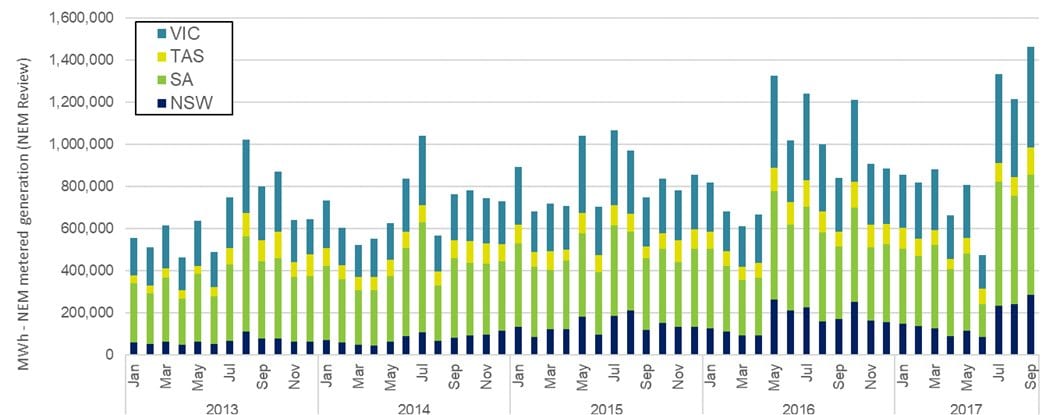
This graph caught our eye. Posted on Twitter on Monday by Tristan Edis, from Green Energy Markets, it shows the big month that wind energy enjoyed in September across the National Electricity Market.

According to Edis, the wind farms in Victoria, South Australia, Tasmania and NSW achieved a new output record in September, with an average capacity factor of 49.5% for month.
And how does that compare with the Liddell coal generator, that the Coalition is trying to force AGL Energy to keep open in the name of “reliability and cost”.
Well, Liddell had a capacity factor of just 38.2% in the month. And even through 2016/17, it barely operated at more than 50%.
Sign up for CleanTechnica's Weekly Substack for Zach and Scott's in-depth analyses and high level summaries, sign up for our daily newsletter, and follow us on Google News!
Have a tip for CleanTechnica? Want to advertise? Want to suggest a guest for our CleanTech Talk podcast? Contact us here.
Sign up for our daily newsletter for 10–15 new cleantech stories a day. Or sign up for our weekly one on top stories of the week if daily is too frequent.
CleanTechnica uses affiliate links. See our policy here.
CleanTechnica's Comment Policy