How Germany Generates Its Electricity
Support CleanTechnica's work through a Substack subscription or on Stripe.
Originally published on Carbon Brief.
By Simon Evans
Germany’s “Energiewende,” which translates as energy transition, conjures up images of bright, sunlit fields scattered with wind turbines and solar panels. But to its critics, it is a story of continued reliance on coal.
Both stories are illustrated in Carbon Brief’s new interactive map of Germany’s electricity generating capacity. Our series of charts show how the coal problem reveals the challenge of decarbonising heat, transport and industry – issues that have remained largely hidden in countries such as the UK.
Tomorrow, Carbon Brief will also be publishing a timeline tracking the history of the Energiewende and the German government’s attempts to secure its future.
German energy in 2016
In common with many other rich nations, Germany’s energy use is in decline, even as its economy grows. (There have been ups and downs: the first half of 2016 saw energy use increase by nearly 2% year-on-year).
Germany used 320 million tonnes of oil equivalent (Mtoe) in 2015, the same amount as in 1975. UK energy use has fallen even further, and is now at 1960s levels. (To clarify, this is referring to all energy used by the countries, not just electricity.)
Oil overtook coal as Germany’s number one fuel in the early 1970s and today accounts for more than a third of the total. Coal use roughly halved between 1965 and 2000. Yet it has remained relatively flat since then and still supplies more energy than all low-carbon sources combined.
Top: German primary energy use by source, millions of tonnes of oil equivalent, 1965-2015. Bottom: Shares of Germany energy use, %. Source: BP Statistical Review of World Energy. Charts by Carbon Brief using Highcharts. Select sources by clicking on the legend. Hover over the chart for more information, including change in emissions compared to 2005 and shares of that year’s total.
Fossil fuels supplied 99% of German energy in 1965 and 89% in 1990, with nuclear making up the difference. By 2015, the 79.7% fossil share was the lowest in at least half a century, as nuclear’s decline to 6.5% was outweighed by a record-high 13.8% contribution from renewables.
Renewables supplied around a third of German electricity in 2015 (see chart, below). However, only around 13% of heat came from renewable energy and 5% for transport. The country has an EU target to source 18% of its energy from renewables by 2020.
(Note that the primary energy figures in this chart are derived by BP using the partial substitution method. This substitutes nuclear or renewable electricity with the amount of fossil energy needed to generate an equivalent amount of power in a thermal plant.)
On this basis, wind was the top renewable energy source in 2015, supplying 46% of renewables’ share. Biomass supplied 26% and solar 20%, with 10% from hydro. Renewables have grown rapidly from a low starting point, with wind more than doubling since 2005 and solar tripling.
German emissions
Despite falling energy use and increasing renewable output, greenhouse gas emissions are virtually unchanged since 2009 at 27% below 1990 levels. This leaves Germany a long way from its 2020 target of cutting emissions by 40%. It is also falling short of goals to cut energy use.
Most obviously, the failure to reduce emissions reflects continued reliance on coal generation and flat emissions in the power sector (dark blue bars, below). Yet it also reflects stubbornly flat emissions from transport (light blue), stuck at 1990 levels, as well as agriculture (orange).
German greenhouse gas emissions, millions of tonnes of CO2 equivalent (MtCO2e), 1990-2015 and targets to 2050. Hover over the chart to see how sectoral emissions have changed since 1990. The category “other” includes waste, fugitive emissions from fossil fuel extraction and distribution, commercial heating and the military. Source: Federal Environment Agency (UBA), including estimates for 2015. Chart by Carbon Brief using Highcharts.
The German environment agency points to transport as one of the key reasons for the slight increase in emissions during 2015, along with cooler weather. While transport emissions rose in both countries last year, dramatic falls in UK coal use obscured its similar lack of progress.
Power sources in Germany
Coal remains the bedrock of electricity generation. The 49 gigawatts (GW) of hard coal and lignite capacity met 46% of domestic demand in 2015 (see below). The 21GW of lignite includes four of the top five CO2 emitters and 9% of all emissions in the EU Emissions Trading System (EU ETS).
The coal plants are located close to historic coal mining regions in the Ruhr, Saar and Lusatia. In the latter, in the former East Germany, a collapse in coal mining jobs has added to the economic dislocation of reunification and the demise of Soviet-era industry.
Attempts to attract tourism and other businesses to replace lignite have had mixed success. In July, state-owned Swedish utility Vattenfall signed off the sale of its loss-making lignite mines and power stations in Lusatia, ignoring calls for the assets to be wound up. The sale faces delays.
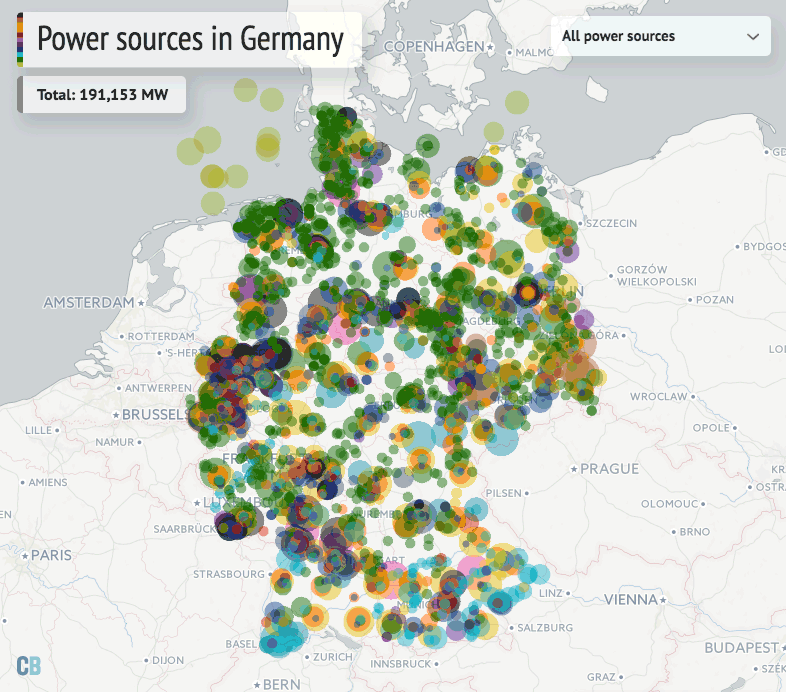
Distribution of electricity generating capacity in Germany. You can explore an interactive version of the map at the link at the top of this article. See notes below. Credit: Rosamund Pearce for Carbon Brief.
Renewable energy infrastructure in Germany is located broadly in line with available resources, as it is in the UK. Much of it is at smaller sites below 10 megawatts (MW) capacity, reflecting the high proportion of German renewables owned by energy cooperatives rather than large energy firms.
Carbon Brief’s interactive map shows totals for smaller sites, aggregated at the level of Germany’s 100 postcode regions (see notes, below). Solar, though widespread, is skewed towards southern states, such as Bavaria, which, with its mountainous regions, also boasts the most hydro capacity.
Windfarms are predominantly in the North, particularly along the North Sea coast, though higher subsidies in areas with less wind have increased their distribution somewhat. The geographic split between the wind-rich north and power-hungry south is a major headache for Germany’s grid.
The below-20% average load factor for German onshore windfarms is an interesting counterpoint to the debate over whether parts of the UK are windy enough to generate wind power economically. UK onshore wind load factors currently average more like 26%. Germany’s overall wind capacity factor rose to around 22% in 2015, as it added more productive offshore sites.
Electricity generation
Nuclear power is already at its lowest share since reunification, with output down 44% since 2005. It is set to fall further towards a planned 2022 phaseout (see Carbon Brief’s forthcoming timeline on the history of the Energiewende).
Still, Germany’s seven remaining nuclear power plants with their 11GW capacity generated 92 terawatt hours (TWh) of electricity in 2015.
Top: Gross electricity generation in Germany, terawatt hours (TWh), 1990-2015. Bottom: Shares of generation. The shares are calculated net of exports, which reached a record 50TWh in 2015. Most German power exports end up in the Netherlands, Belgium, UK and Italy, according to solar research institute Frauenhofer ISE. Source: AG Energiebilanzen. Charts by Carbon Brief using Highcharts.
Nuclear’s output in 2015 was more than the combined total from 39GW of solar (38TWh) and 7GW of biomass (44TWh). It was also slightly more than the output of Germany’s 45GW of windfarms (88TWh). This shows the scale of renewable capacity needed to replace nuclear as it phases out.
However, renewables already generated a third of German electricity during 2015. Their large capacity means they can meet close to 100% of demand during sunny and windy off-peak periods.
For now, exports can balance out this surplus. However, high wind and solar output has helped reduce power prices, bringing economic challenges to renewables themselves as well as German utility firms. (Overcapacity and commodity market prices are also contributing to low power prices.)
In the longer term, emerging seasonal energy storage options, such as power-to-gas, are likely to be needed to balance variations in renewable output. Power-to-gas remains expensive. There is disagreement over how soon additional storage will be needed.
Historic shifts
The data in our interactive map reveals some interesting changes in the types of infrastructure being built to generate Germany’s electricity. The chart below gives an at-a-glance summary of the shifts in the country’s grid mix since 1960.
It also shows the ever-present coal plants that still supply around half of Germany’s power. Coal capacity has been added fairly consistently over the past half century, with a dip in the period after 2000 as utility firms adjusted to newly liberalised energy markets.
The roughly 10GW of new coal added since 2012 was planned and consented some years earlier. Indeed, high-level political support for new coal power remained strong until at least 2009 (see timeline). Two more hard coal plants proposed in this period are still under construction, including the much-delayed 1GW Datteln site, which faces an uncertain future.
The 1970s saw a shift towards gas and nuclear additions, with new reactors being built steadily throughout the 1980s despite Germany’s active anti-nuclear movement (see timeline). In common with many other nuclear states, however, it stopped adding to its fleet in the wake of Chernobyl.
After Fukushima in 2011, chancellor Merkel ordered the closure of a number of reactors and reinstated a plan to close all others by 2022. The next sites due to close are Gundremmingen (1.3GW, in 2017) and Philippsburg (1.4GW, in 2019), both in southern Germany (see map, above).
Power capacity additions in Germany (GW) in each year, 1960-2015. All closures are shown since 2011 while nuclear closures are shown throughout the period. Source: German Federal Network Agency (Bundesnetzagentur, BNetzA), International Atomic Energy Agency (IAEA) PRIS database and Carbon Brief analysis. Charts by Carbon Brief using Highcharts.
The chart also shows how Germany’s renewable generating capacity has almost all been added since 2000, the year the first Renewable Energy Act (EEG) was passed (see Carbon Brief’s forthcoming timeline on the history of the Energiewende).
Solar growth peaked around 2011 and then declined, as feed-in tariffs were reduced. Germany agreed a switch to auctions in July, partly to satisfy EU rules and partly to more tightly control costs.
(A renewable surcharge added to bills will rise in 2017, but wholesale prices are falling on declining commodity markets and zero-marginal cost wind and solar output. Average consumer bills have fallen slightly in each year since 2013, Bloomberg reports).
The auction reform has proved controversial. Some fear grassroots generators will be pushed out by rules that only large firms can navigate, while others fear it will put climate targets at risk.
The decision to cap renewable energy expansion puts Germany’s climate targets “in danger,” according to Maria Krautzberger, president of the Federal Environment Agency (UBA).
Auctions for renewables will start in 2017 with a “deployment corridor” limiting solar to 2.5GW a year and onshore wind to 2.8GW. The target is for 40-45% of electricity to come from renewables by 2025, which would mean slower growth in green energy than in recent years.
Offshore wind had a bumper year in 2015, when nearly 2GW was added. This surge came to end in the first half of 2016, however. Offshore wind will join the auction system only after 2021.
Germany’s transmission grid operators still expect 20GW of renewable energy capacity to be built over the five years to the end of 2020, including 7GW of solar and 12GW of wind.
Germany’s biomass electricity generating capacity is mostly made up of small anaerobic digestion plants (biogas) running on farm waste and maize (see map, above). In contrast, UK biomass is dominated by the burning of wood pellets at Drax. Formerly the country’s largest coal-fired power station, half of its six units now burn biomass.
Biogas growth in Germany has tailed off on falling subsidies and limited feedstock availability. Biogas could offer flexible power to balance intermittent wind and solar, but plants tend to run full-time to maximise subsidies. Reforms introduced in 2014 are designed to reward flexibility.
A 2014 plan to shave 22MtCO2 off lignite emissions was scrapped after opposition from unions and industry. Instead, eight lignite plants will be mothballed by 2020, starting from October 2016. The European Commission-approved plan is to cost €1.6bn and save just 11-12.5MtCO2.
The economics of coal and gas remain unfavourable, with renewables, commodity prices and overcapacity pushing the cost of wholesale electricity down by two-thirds in five years. Seven coal plants totalling 1GW and six gas stations of another 0.9GW are planning to close before 2020.
Notes
The map of electricity generating sites is based on data published by the German Federal Network Agency (Bundesnetzagentur, BNetzA) published on 10 May 2016. Most locations are based on postcodes converted to degrees latitude and longitude. Therefore they are not pinpoint accurate.
Locations for some large sites have been manually adjusted for accuracy. For multi-fuel sites, the main fuel is shown in the map. Larger power plant capacities are shown as larger bubble sizes, with the spread of bubble sizes allocated using the Jenks method.
For small renewable power sites below 10MW capacity, totals have been aggregated at the postcode region level for each technology type. Germany is divided into around 100 regions represented by the first two digits of the five-digit German postcode (PLZ).
For the purposes of our map, these aggregated totals are centred on the average location of small sites in each region, calculated as the average latitude and longitude in degrees.
The additions-and-closures chart only contains information on power plant closures since 2011. However, all nuclear power plant closure dates have been added using the IAEA PRIS database.
For renewables, construction year and location data is extracted from the Renewable Energy Act (EEG) register compiled by the EnergyMap.info website.
This data, containing more than 1.5 million individual sites, runs to August 2015. Updates have ceased so the data has been supplemented and cross-checked using various sources including the International Renewable Energy Agency (IRENA).
Reprinted with permission.
Sign up for CleanTechnica's Weekly Substack for Zach and Scott's in-depth analyses and high level summaries, sign up for our daily newsletter, and follow us on Google News!
Have a tip for CleanTechnica? Want to advertise? Want to suggest a guest for our CleanTech Talk podcast? Contact us here.
Sign up for our daily newsletter for 15 new cleantech stories a day. Or sign up for our weekly one on top stories of the week if daily is too frequent.


CleanTechnica uses affiliate links. See our policy here.
CleanTechnica's Comment Policy