A Lesson In Solar From A Northern Neighbor
Originally posted at ilsr.org.
Based on population, Ontario would be the 5th largest state if it were part of the U.S., but its installed solar capacity, 1,500 MW would rank it 3rd. The province has also shut down all its coal-fired power plants. How does a northern province become a solar and climate leader, despite one of the poorest solar resources in North America?
Smart policy.
In 2008, the province adopted a feed-in tariff program, offering any Ontario individual or business the right to connect a solar array to the grid and get paid on a long-term contract with sufficient revenue to make a modest return on investment. The policy was noteworthy for also requiring the purchased solar arrays to be made in Ontario, juicing up the economic benefit of the solar purchases.
There was a surge of interest, and program administrators quickly fell behind in processing applications. In ILSR’s 2013 review of the feed-in tariff program, we applauded the 5,000 MW of new renewable applications, but noted that significant delays in connecting projects—just 10% were operational—meant the province fell short of its jobs and economic development goals. Despite the delays, Ontario still surged past most U.S. states in solar capacity (only California and Arizona have more). And although its goals were higher, the projects developed through 2013 still led to over 30,000 new jobs in the province.
Ontario’s feed-in tariff also meant a wide diversity in solar ownership. Reports from the feed-in tariff program suggest that as many as 1 in 7 Ontario farmers were able to supplement their agricultural income with solar.
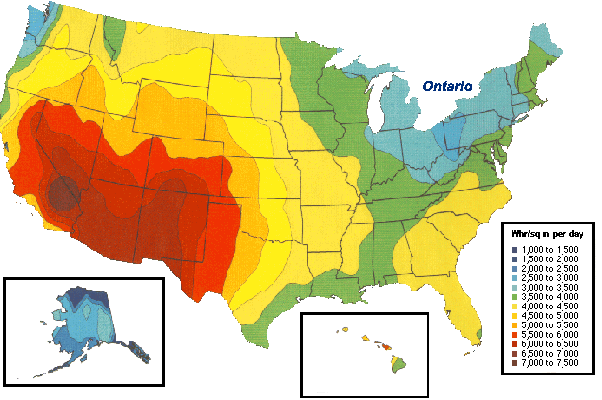
The accomplishment is even more remarkable given the poor solar resource. Ontario’s is worse than almost every U.S. state. A comparable solar array in California or Arizona will produce nearly twice the electricity as one in Ontario.
Given the relative solar resource (and the closing of coal plants), you might assume electricity in Ontario has high electricity prices, but the reverse is true. The monthly average wholesale power cost in Ontario was just 1.65¢ per kilowatt-hour in March 2015.
The Ontario lesson is that solar development takes good policy, and the more democratic the policy, the wider the benefits.
This article originally posted at ilsr.org. For timely updates, follow John Farrell on Twitter or get the Democratic Energy weekly update.
Have a tip for CleanTechnica? Want to advertise? Want to suggest a guest for our CleanTech Talk podcast? Contact us here.
Our Latest EVObsession Video
CleanTechnica uses affiliate links. See our policy here.
The wholesale cost of power may be low, but the retail price, along with the many fees added to residential bills to cover restructuring and nuclear maintenance costs make it some of the most expensive power in North America.
To be fair, those fees and charges aren’t due to the solar FIT.
Right… there are some fixed costs + taxes that make it so that even if you use no electricity at all, you’re monthly bill will still be 30-40 dollars.
Do You Want To Make Money Like Google and Facebook? It’s easy you just have a internet connection and a p.c to earn money…Click below link for more details
=========>>>> Run to my account for more information
fdfgedr
Thanks for the stats. I have been curious about Ontario’s accomplishments for a while now. They adopted the German model of high reward for residential PV. It worked, although there was a lot of grumbling in the early days. Some blamed higher electricity rates on the solar subsidies. This was ridiculous considering the very small percentage of electricity excess that was actually produced. Ontario doesn’t have the hydro resources of B.C. (95% electricity) or Quebec (100%). And thank you for giving a gentle geography lesson to American readers who are strangely illiterate about the enormous and resource rich country that hovers just above their heads.
Ontario’s accomplishments…the big Blue Conservative machine held them up for decades and they currently accuse a Liberal career mr fixit of getting a huge solar farm contract.
As a resident from there, it was all Nuke reactor go go go, in the 70s.
My hydro then, there, came from Niagra Falls…over the continental fault line.
So did we in the UK which led to a surge in PV installation which resulted in a quick about turn on govt policy, seems that it’s ok to give millions to FF and nuclear but a few pennies to the masses? Not good policy
Wait, there’s a whole _country_ above us?
Oh yeah, I think I imported my wife from there! 😉
Residential rates in Ontario are > 15c/KWh once you factor in Delivery and Debt retirement charges.
Though getting rid of Coal and having cleaner air is priceless, and it is noticeably cleaner. Smog days were a regular occurrence are almost non existent now.
That’s 15 cents Canadian/Kwh. The Canadian dollar is almost 30 cents lower than the U.S. dollar, so that would be about 12 cents U.S. / Kwh.
Household earnings are in Canadian dollars as well. Your comment would seem to be irrelevant.
The map in the article is not wrong, but it could certainly could confuse as it doesn’t show sunlight falling on solar panels but rather on the ground while solar panels are angled to catch the sun. Ignoring the effect of heat, one kilowatt of optimally angled solar panel in Toronto will produce an average just under 4 kilowatt-hours of electricity a day, while an identical one kilowatt of optimally angled panel in Pheonix Arizona would produce an average of about 5.9 kilowatts a day or about 50% more. In real life conditions the difference is likely to be less because the hotter weather in in Arizona will reduce the panel efficiency. But on the other hand, they apparently have some sort of strange, white precipitate that sometimes falls out of the sky, so I guess that could reduce panel efficiency there. Of course, in Toronto the panels should be angled quite steeply, so hopefully that weird stuff will just slide right off.
So I just looked it up on PV Watts. Toronto Ontario, yearly production per kw roofmount at latitude is 1200 kwh per year. Phoenix Arizona, the Sunniest site in The US is 1728kwh per year. So a little over 66% of the PV production. Not bad. Consider that Phoenix may be among the sunniest places on the planet.
Hey vensonata, can you post that url? Some would like to have it.
pvwatts.nrel.gov/ is the site. Absolutely indispensable for anyone interested in solar.
I presume those would be real world figures, so they would be much better than just going by insolation on an optimally aligned fixed panel, as I did.
There is so much good news here. I’m excited about the liberals coming into power as relates to renewables (and general sanity).
Ontario’s success should be a lesson to places in the US that would seem less than ideal for solar, like northwest Washington. I have a friend who lives north of Seattle, near Burlington, in the Skagit Valley. He told me that he wanted to consider solar panels on his barn. The same day, his wife told me that there wasn’t enough sun to consider solar. I guess they don’t talk to each other much.
There is an inconsequential error on the map in the article. The bright yellow and medium yellow are inverted on the map.
Wasn’t Ontario’s “buy local” condition ruled illegal by the WTO? If you are going to be protectionist, both Brazil and India have found ways of getting round international free trade rules. Brazil makes cheap loans from the state investment bank dependent on Brazilian content. India has local content rules for projects by state-owned companies. I’m not defending protectionist subsidies to local producers at the expense of consumers, but Ontario’s were particularly badly designed.
I never did get all that local content hubbub. Here US has a local content requirement built right into NAFTA and sues India for local content in solar.
Seems hypocritical to me. I don’t know one way or the other about local content, but I do know everybody should get the same rules.
I live in eastern Ontario and have had a 5.7 kW rooftop system feeding into the grid as a “microFIT” producer for 5 and one half years into a 20 year contract. I was at the bleeding edge so to speak of the program. At the time, there was a very hard made in Ontario minimum you had to meet, but Japan sued the Ontario government under the free trade rules, so we no longer have the minimum made in Ontario content rules.
Our retail rates are prisoners of our legacy nuclear fleet, as well as playing catchup for grid modernisation after letting the grid atrophy for decades.
Ontario can now make an honest claim to having a majority of our grid carbon free. We do have some new gas peaked plants.
In my personal situation, we have injected 43.3 MWH directly into the grid since system commissioning in May of 2010. We have consumed 38 MWH over the same period, thus we have been a net producer of about 1 MW a year, using the grid as a battery. If we can do it at our latitude here in eastern Ontario, folks in the states will be able to do it. Cheers. Mike
The use of solar in Ontario to replace coal is a wonderful story, but one does have to understand that coal was only generating about 2% of the electricity in Ontario in 2013. Wind was already generating about 3% at that point, so if anything wind power should be getting more of the credit.
The time frame is exactly what Im talking about.
The switch away from coal is great, but as you point out coal was already replaced before solar came into the picture.
The article notes that solar was only picking up speed by 2013, by which time coal was already pretty much gone.
The expansion of wind power from nothing to a quite respectable slice of the power supply was an earlier development, hence wind power perhaps deserves a good bit more of the credit. Showing that wind can replace coal (at least in a place with a solid core of hydro and nuclear) is very important in the demise of coal.
Its nice that solar is being proven to be viable in Ontario, but it has arrived after coal, not during the replacement period.