
18 Fun Renewable Energy Charts From NREL Director Dan Arvizu & Ren21’s Renewables 2013 Global Status Report
Support CleanTechnica's work through a Substack subscription or on Stripe.
I had the good fortune of seeing NREL’s director, Dan Arvizu, give an optimistic renewable energy and cleantech presentation in Abu Dhabi in January. He certainly knows how to pack a presentation full of interesting charts. More recently, Dan gave a presentation in Colorado that I didn’t attend but have the slides for. (Actually, the slides are online [PDF].) Below are a few of my favorite slides from the new presentation, followed by several fun charts and tables from the key findings of Ren21’s Renewables 2013 Global Status Report. (Thanks to a reader for tipping me off to both presentations!)
Renewable Energy Charts & Facts
This first chart is on annual capacity growth rates for renewable energy technologies:

Here’s a look at the world leaders for specific clean energy technologies (at the end of 2012):
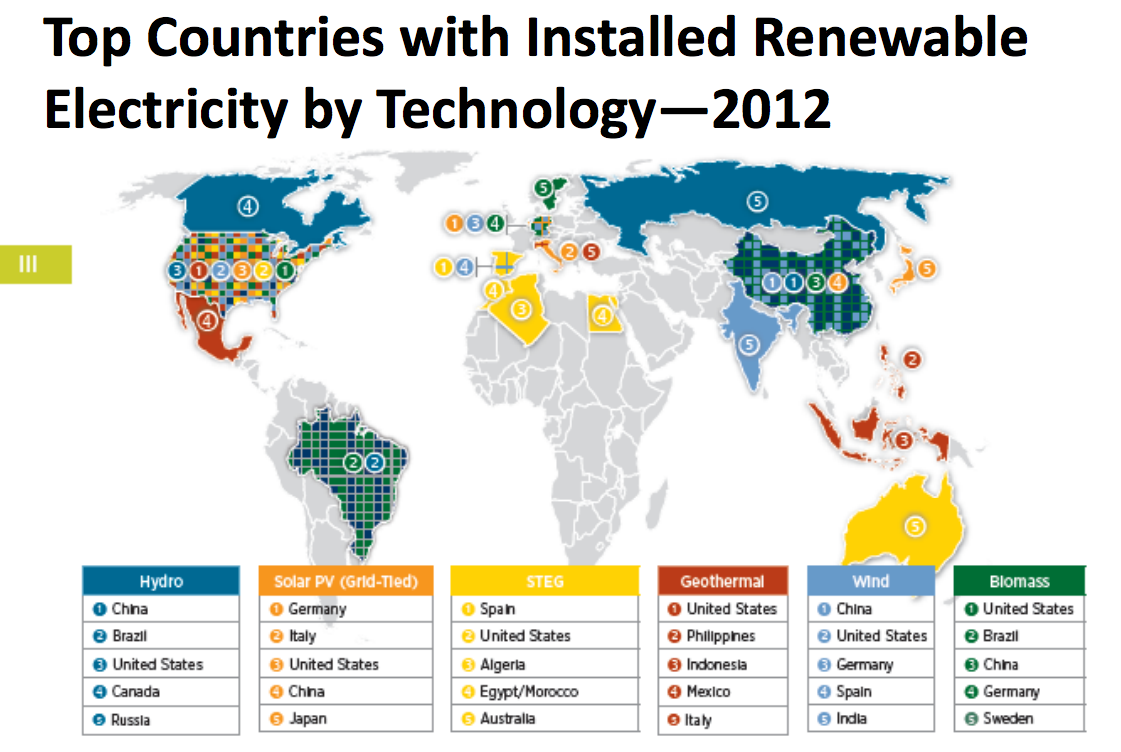
Naturally, the pure capacity leaders are not necessarily the per capita or per GDP leaders — normally they aren’t (a gripe I have with these types of ratings). For the latest on those for wind and solar, see:
The next chart, moving away from renewables to energy use on the consumer level, is a super fun one in my opinion. Ever wonder where homes & businesses are using their energy? This chart has the details:

There’s much more in Dan’s presentation, including many slides on NREL’s extremely high-tech, energy-efficient, LEED-platinum campus. Check it all out for more fun.
Below are now charts from Ren21’s Renewables 2013 Global Status Report. As always, I recommend checking out the full report. However, I’ve also gone ahead and pulled out several of my favorite charts to share below. Enjoy! (If you’ve already checked out Dan Arvizu’s presentation, you’ll notice that some of the charts from the Ren21 report were used in that.)
Global Renewable Energy Charts & Facts
Here’s an estimate of renewable energy’s share of electricity production at the end of 2012:
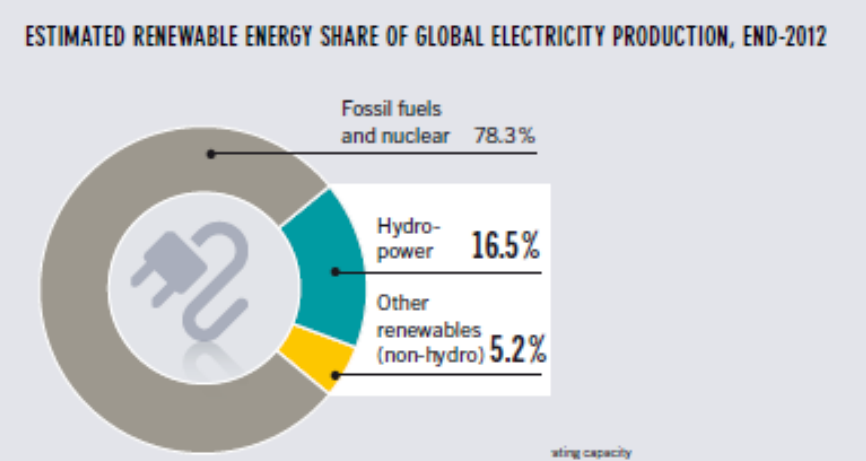
Non-hydro renewable being at 5.2% can be seen in a positive or a negative way. It’s much higher than it was just a few years ago, but it’s still a relatively small percentage. However you look at it, though, definitely realize that it is growing fast and will for years to come. We’re just getting started!
Here’s an even closer look at global renewable energy capacity, showing the totals by country at the end of the past 3 years:

Here’s a look at the world’s non-hydro renewable energy capacity leaders (again, in terms of total not relative capacity):

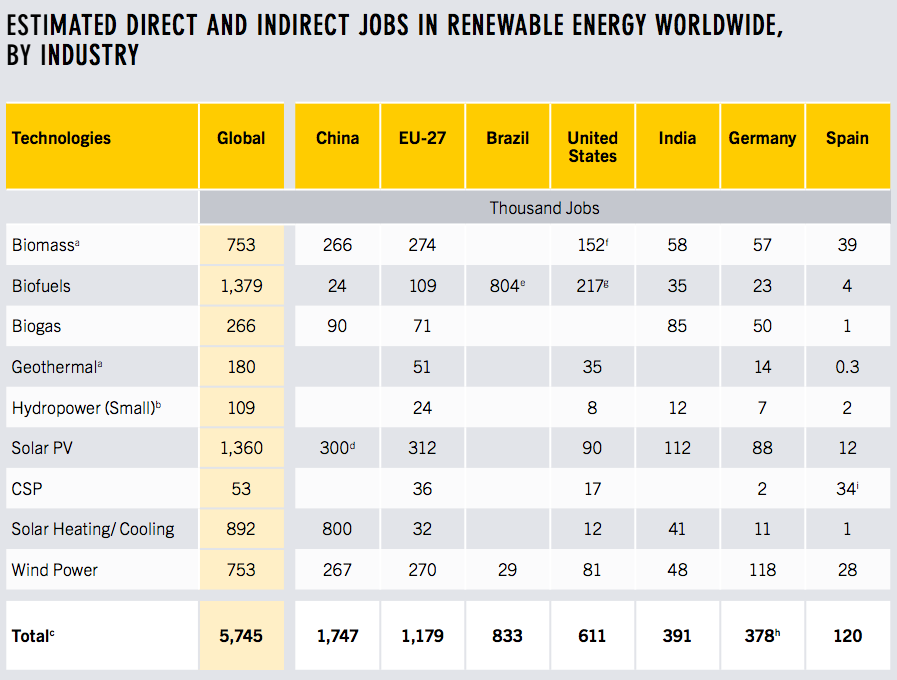
Here’s a great summary of global renewable energy jobs totals, and totals for some leading economies:

Here’s a look at how many and which countries have renewable energy policies (early 2013 compared to 2005):

Solar Energy Charts & Facts
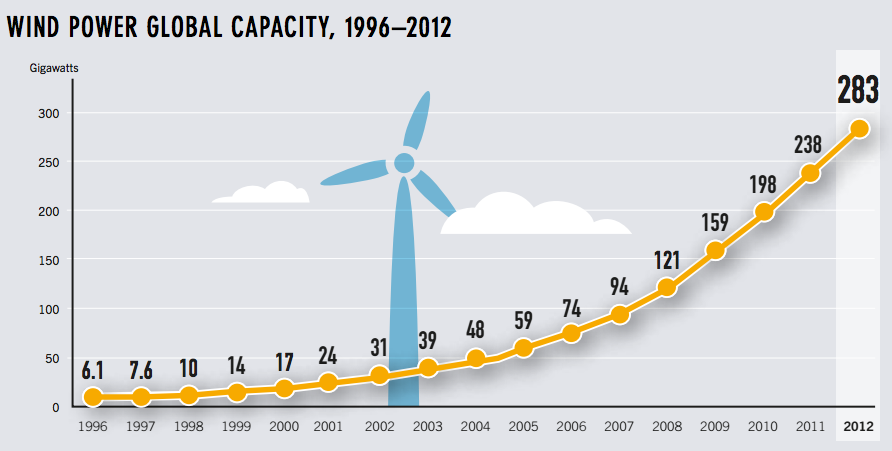
Getting into solar energy specifics more, here’s a look at global solar PV capacity growth:
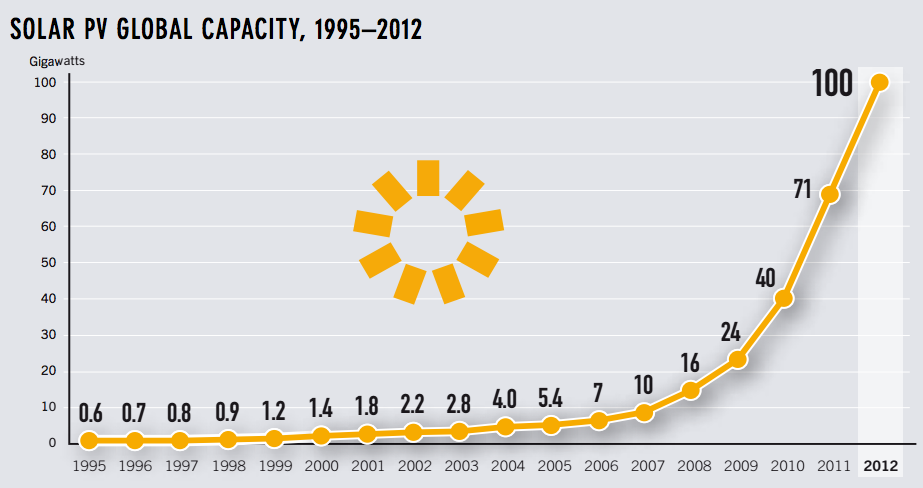
That’s a nice curve if I’ve ever seen one!
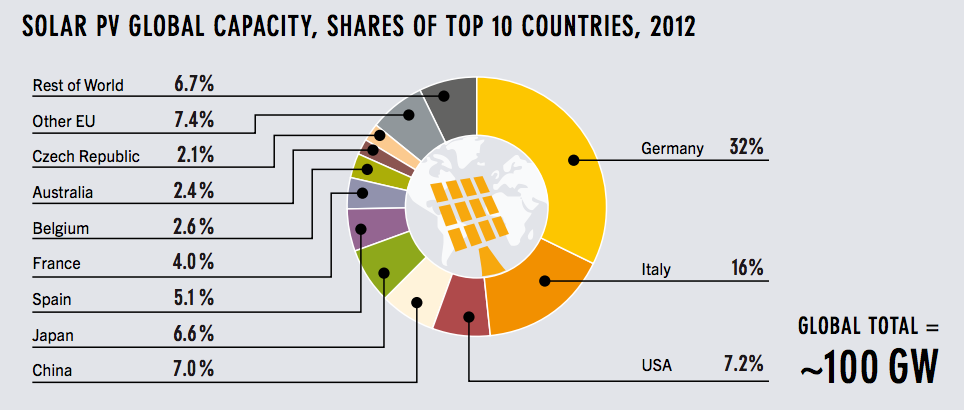
Here’s a look at solar PV’s global capacity split at the end of 2012:
Here’s a look at the top solar PV module manufacturers at the end of 2012:

Here’s a look at the growth of solar water heating around the world:

Here are the leading solar water heating countries in terms of 2011 additions:

Wow. Go, China!
And this last solar chart shows global solar thermal capacity growth:

Wowza! And expect 2013’s total to be much bigger.
Wind Power Charts & Facts
Wind power has grown at a similarly impressive rate. Check out these three charts for more on that as well as on the leading wind power countries and companies:


If you might want more, check out this brief summary of the Renewables 2013 Global Status Report and then get your butt over to the report’s key findings (or just jump straight over to the full report):
Renewable energy markets, industries, and policy frameworks have evolved rapidly in recent years. The Renewables Global Status Report provides a comprehensive and timely overview of renewable energy market, industry, investment, and policy developments worldwide. It relies on the most recent data available, provided by a network of more than 500 contributors and researchers from around the world, all of which is brought together by a multi-disciplinary authoring team. The report covers recent developments, current status, and key trends; by design, it does not provide analysis or forecasts.
Also see:
Sign up for CleanTechnica's Weekly Substack for Zach and Scott's in-depth analyses and high level summaries, sign up for our daily newsletter, and follow us on Google News!
Have a tip for CleanTechnica? Want to advertise? Want to suggest a guest for our CleanTech Talk podcast? Contact us here.
Sign up for our daily newsletter for 15 new cleantech stories a day. Or sign up for our weekly one on top stories of the week if daily is too frequent.
CleanTechnica uses affiliate links. See our policy here.
CleanTechnica's Comment Policy