Solar Parity Coming Faster Than Expected
Support CleanTechnica's work through a Substack subscription or on Stripe.
Originally posted at ilsr.org.
Back in 2012, ILSR released a pair of reports on the solar Rooftop Revolution, noting that one-third of Americans would live in a metropolitan area where the cost of solar energy from their roof would be less than the cost of power from the utility by 2021. When combined with our analysis of non-residential property, we estimated that 287 gigawatts of solar would be at price parity with grid electricity across the country by 2021.
It turns out we were wrong, and that the rapidly falling cost of solar is making solar more economical in more big cities than many people expected.
For example, in our original analysis looking for parity between solar and grid electricity prices on residential property in 2015, residents were expected to save money by going solar in only 2 of the largest 42 U.S. metro areas, New York and San Diego.* According to a recently released report by the North Carolina Clean Energy Technology Center, however, grid parity was coming much quicker. A review shows that their study included all applicable federal, state, and local incentives (instead of our no-subsidy analysis), but it gave us a reason to revisit our 2012 analysis.
As it turns out, solar parity––without incentives––has been accelerating.
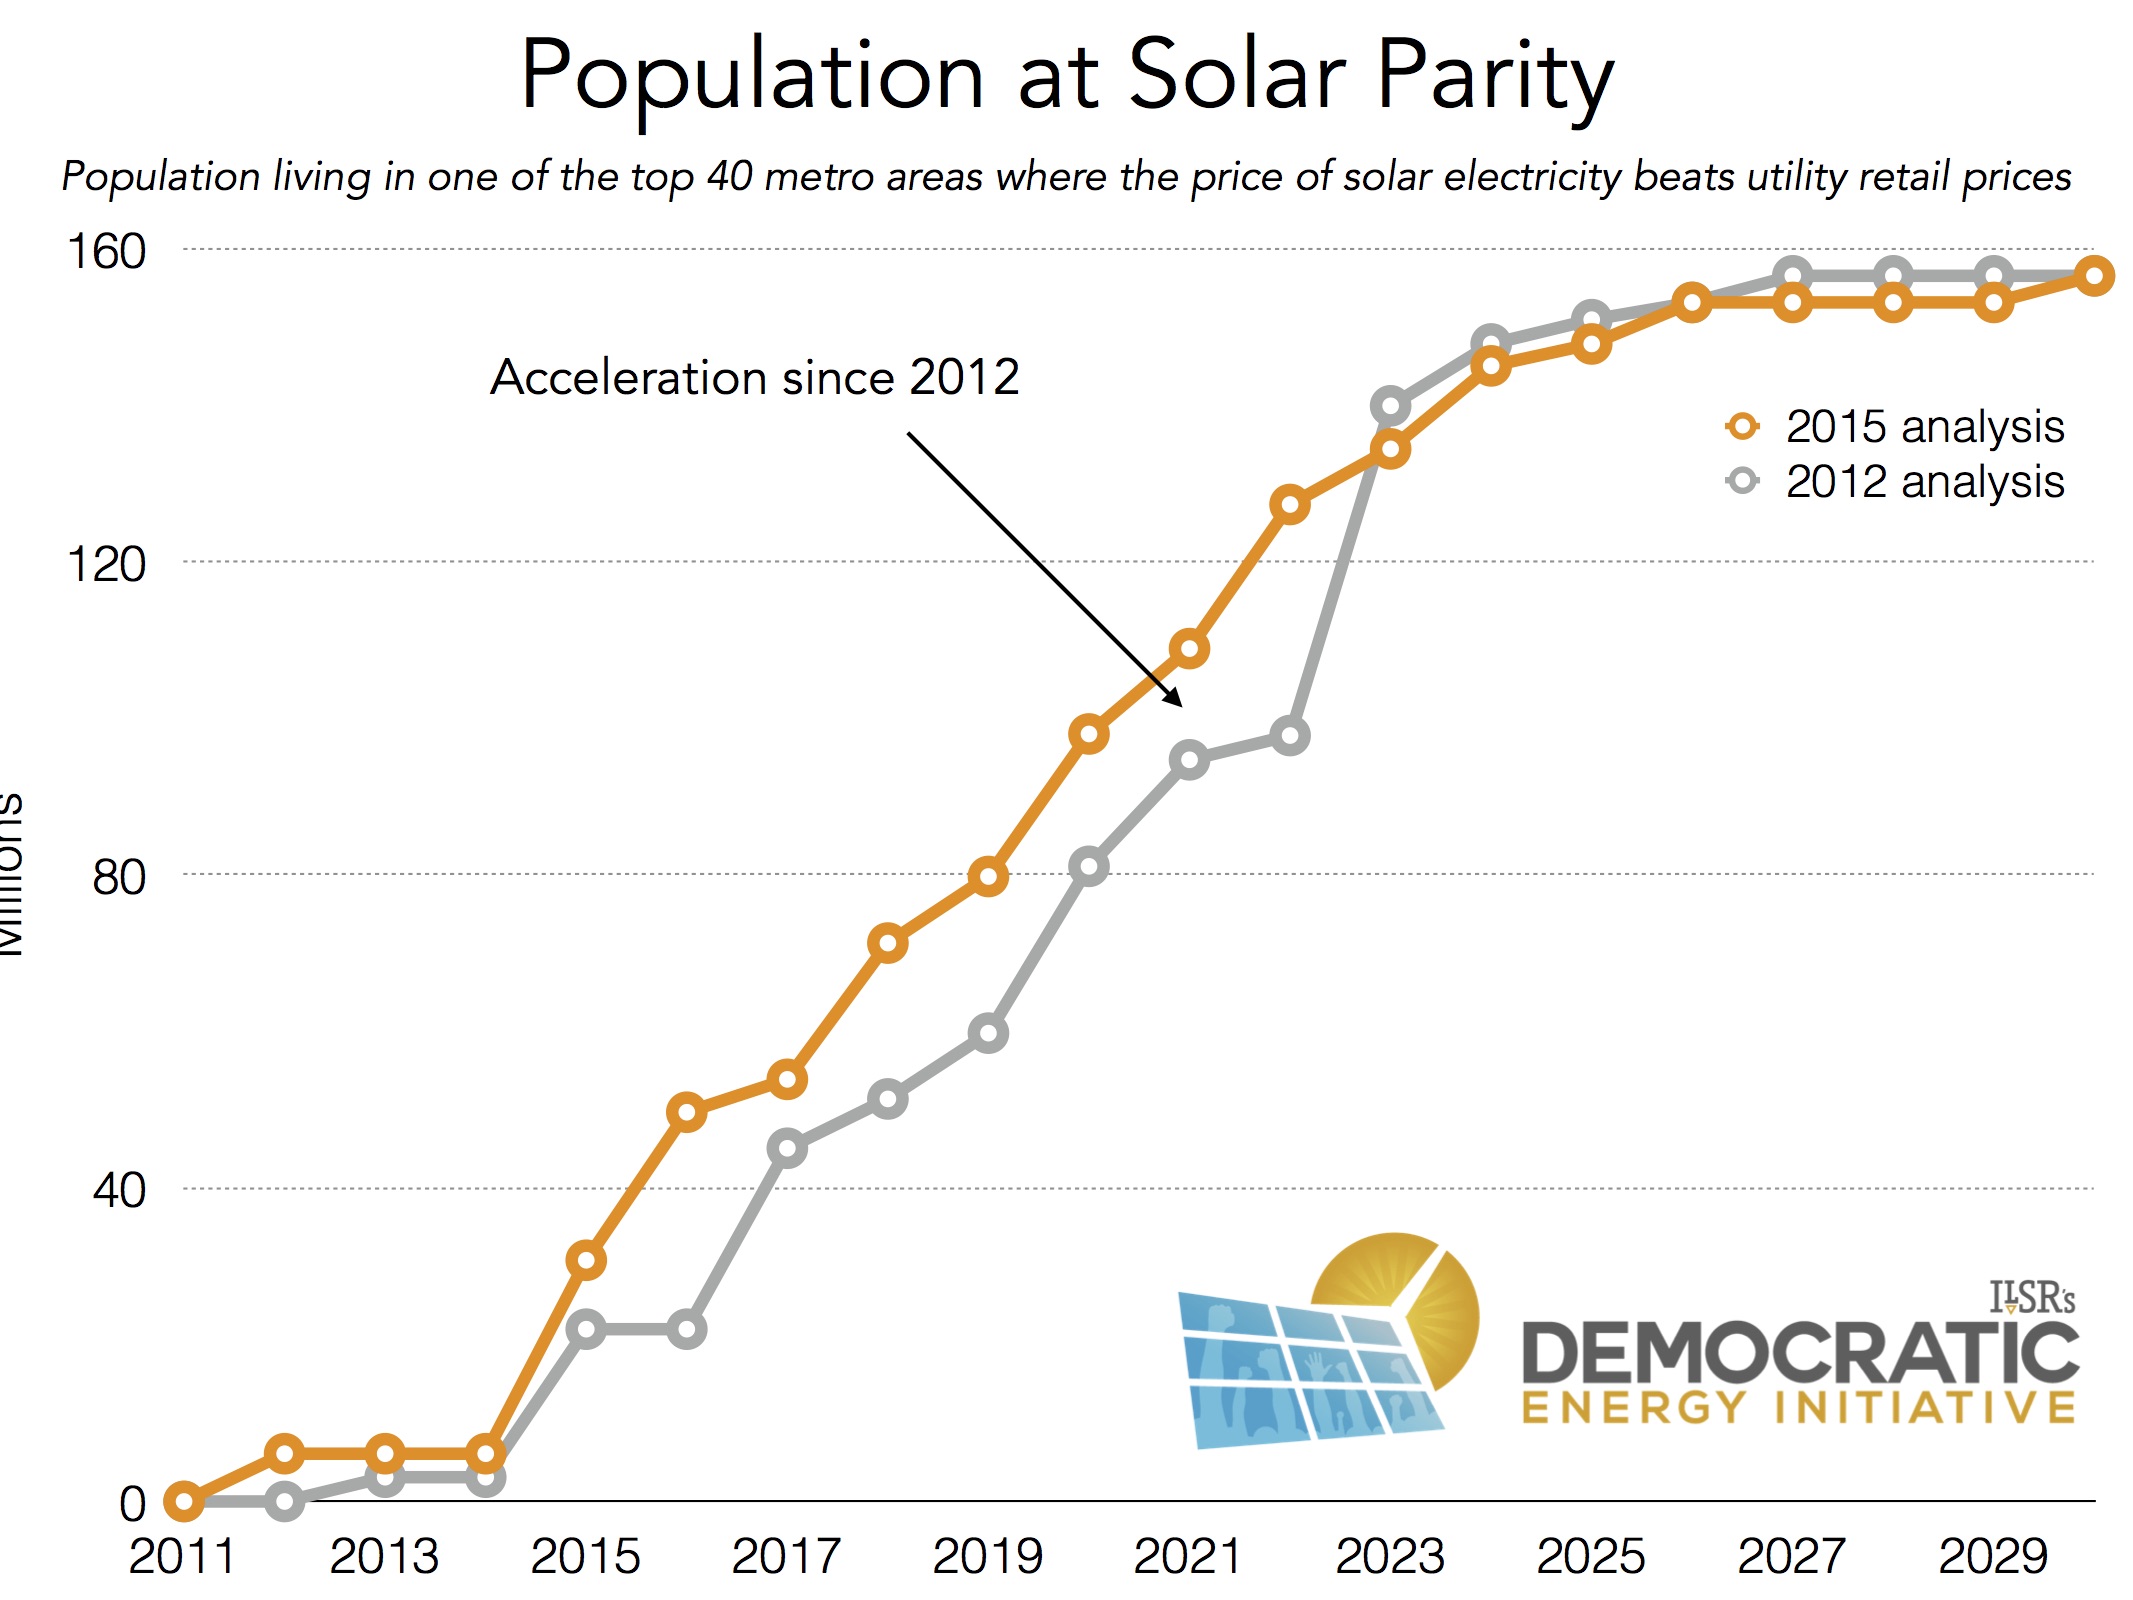
In 2015, six of the largest metropolitan areas are already at solar parity, representing over 30 million Americans. That’s one-third more people living with solar at parity with utility electricity prices than in our original analysis, when we calculated that 2015 would bring parity to just two metro areas, totaling 22 million people. The following table lists the metropolitan areas where electricity from solar installed at $3.50 per Watt––with no incentives––matches the average electricity rate, and a comparison to our original 2012 analysis.
Cities at Solar Parity in 2015
| Metro Area | Original Analysis | Revisited Analysis |
| New York | 2015 | 2016 |
| Boston | 2020 | now |
| San Francisco | 2017 | now |
| San Diego | 2013 | now |
| San Jose | 2017 | now |
| Los Angeles | 2017 | now |
| Riverside, CA | 2017 | now |
In 2017, the five-year point in our original, the population at parity is likely to be 71 million instead of 51 million. By 2021, 109 million Americans will be at parity, instead of our original prediction of 95 million.
Cities at Solar Parity in 2021
| Metro Area | Original Analysis | Revisited Analysis |
| New York | 2015 | 2016 |
| Boston | 2020 | now |
| San Francisco | 2017 | now |
| San Diego | 2013 | now |
| San Jose | 2017 | now |
| Los Angeles | 2017 | now |
| Riverside, CA | 2017 | now |
| Chicago | 2023 | 2018 |
| Dallas | 2019 | 2019 |
| Philadelphia | 2020 | 2018 |
| Houston | 2021 | 2020 |
| Miami | 2021 | 2020 |
| Detroit | 2023 | 2020 |
| Phoenix | 2018 | 2017 |
| Tampa | 2020 | 2021 |
| Baltimore | 2023 | 2021 |
| Denver | 2020 | 2021 |
| Pittsburgh | 2024 | 2020 |
| Sacramento, CA | 2018 | 2019 |
| Las Vegas | 2019 | 2018 |
| Providence, RI | 2020 | 2021 |
| Jacksonville, FL | 2022 | 2021 |
As you may notice in the above chart, some cities have reach parity sooner, and some later. The following map illustrates the changes by city for all 40 metropolitan areas. What’s not captured in the table above or the map is that the acceleration of grid parity seems to be concentrated in the largest metropolitan areas, pushing up the population at parity despite nearly as many cities losing ground toward parity as gained between our new and original analysis.

In the future, we’ll add a bit more, by examining the net present value of a solar investment in each city. This accounts for the fact that an investment in solar can make sense even if the cost of solar electricity is currently higher than retail prices because, in the long run, solar prices are fixed, but electricity prices tend to rise. Early results suggest that nearly 150 million Americans––33% more than a simple parity analysis reveals––will live in a city where a solar investment––without subsidies––pays back over 25 years by 2021. More to come…
Data and Assumptions
*We picked these 42 because half the U.S. population lived in those 42 metropolitan areas in 2012.
- The installed cost of solar for this analysis is $3.50 per Watt in 2015, estimated to decrease 7% per year
- The price of electricity is expected to increase by 2% per year
- Electricity prices for each metro area were taken from the Bureau of Labor Statistics or Energy Information Administration
- Solar insolation data comes from the National Renewable Energy Laboratory’s PVWatts system
This article originally posted at ilsr.org. For timely updates, follow John Farrell on Twitter or get the Democratic Energy weekly update.
Photo Credit: Dennis Wilkinson, via Flickr (BY-NC-SA 2.0 license)
Sign up for CleanTechnica's Weekly Substack for Zach and Scott's in-depth analyses and high level summaries, sign up for our daily newsletter, and follow us on Google News!
Have a tip for CleanTechnica? Want to advertise? Want to suggest a guest for our CleanTech Talk podcast? Contact us here.
Sign up for our daily newsletter for 15 new cleantech stories a day. Or sign up for our weekly one on top stories of the week if daily is too frequent.


CleanTechnica uses affiliate links. See our policy here.
CleanTechnica's Comment Policy