
Cost Of Solar Power 60% Lower Than Early 2011 In US
Support CleanTechnica's work through a Substack subscription, on Patreon, or on Stripe. Help us produce all of the high-quality, original content we publish week after week despite the challenges of content-scraping AI, antisocial media, inflation, and other hurdles.
Originally published on Cost of Solar.
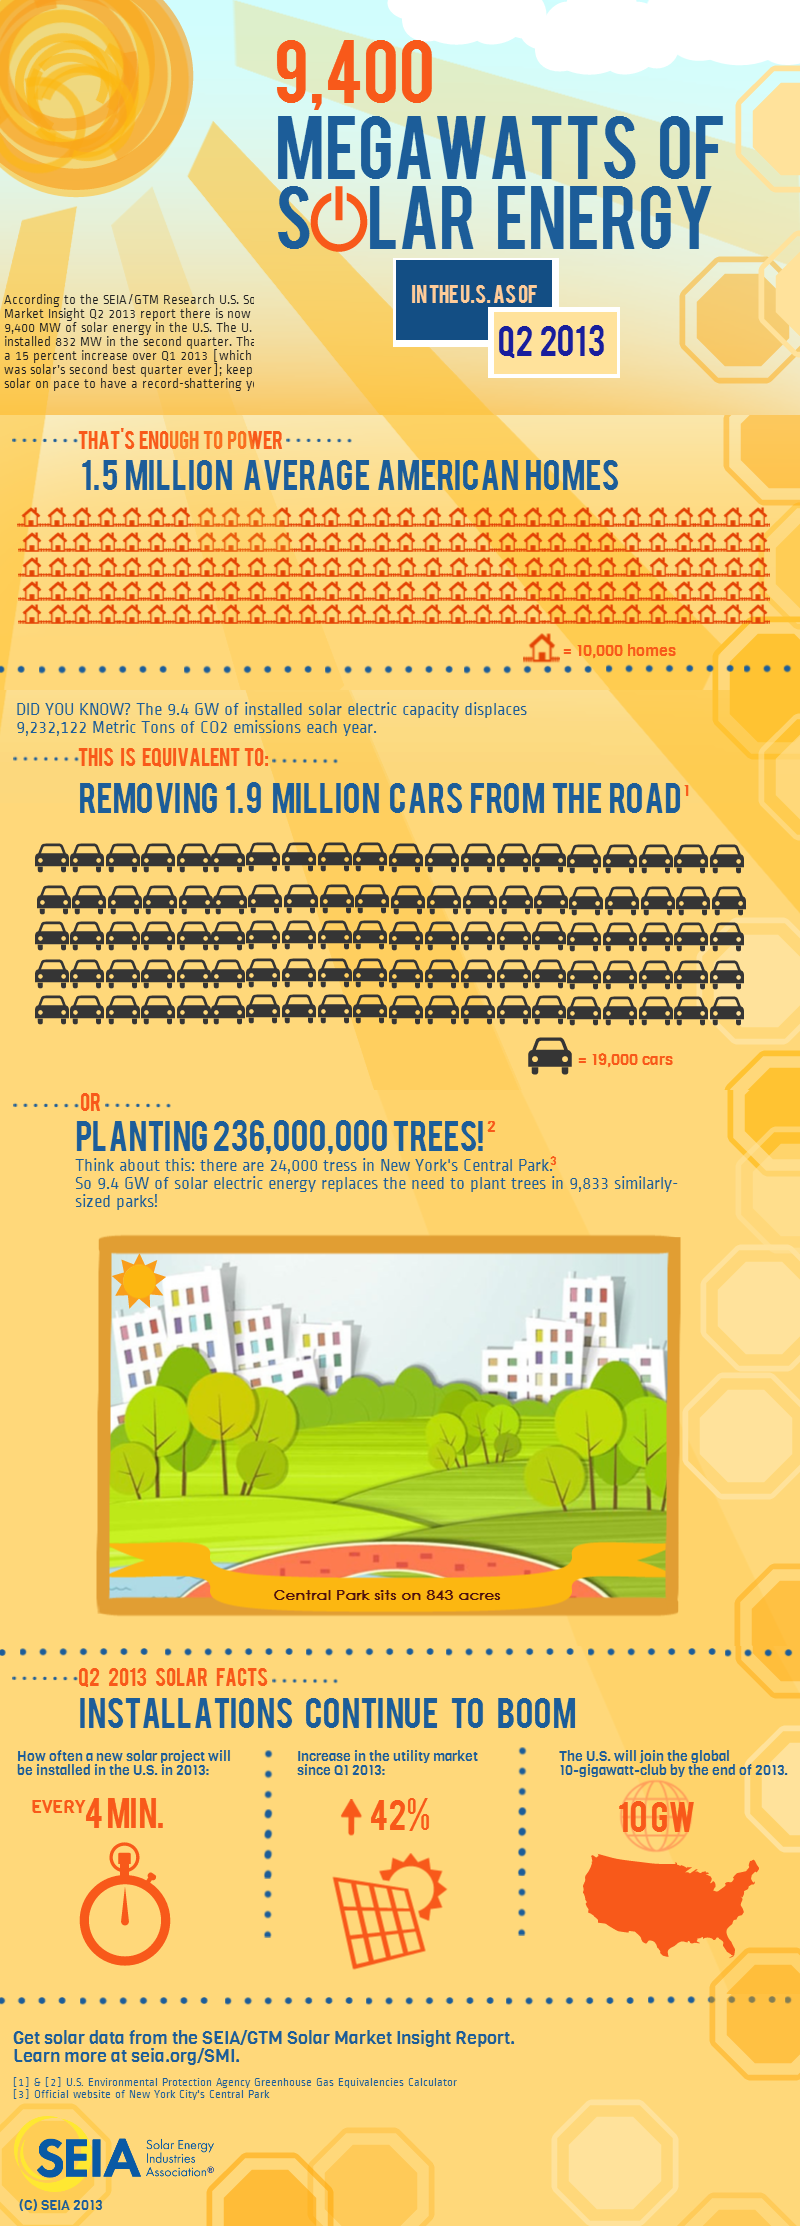
The US Solar Energy Industries Association (SEIA) and GTM Research recently released their latest quarterly report regarding the US solar energy market. There are a ton of interesting facts from the report, such as the solar panel costs fact above. Just a few of these cool solar power facts are in the infographic below. Many more are in the charts, graphs, and text that follow the infographic. Enjoy!!
Solar Panel Costs Down
For one, as the title above notes, solar panel costs were 60% lower in the second quarter (Q2) of 2013 than they were in early 2011. Overall solar PV system prices, on average, were 40% lower, and they were 50% lower than average solar PV system prices in early 2010.
I’ve emphasized this before: if you have a cost of solar from a few years ago stuck in your head, you’re probably greatly overestimating the cost of solar today. (Get an updated estimate and an estimate of your monthly and yearly savings today.)
US Solar Power Growing Fast
Aside from the massive cost drop, another point worth noting is that solar power continues to grow strongly. Q2 was the second-biggest quarter for solar power growth in US history, only trailing Q4 2012 (primarily due to a drive at the end of the year to install a lot of solar in time to take advantage of 2012 tax credits — the 4th quarter is always the strongest of the year). In total, 832 megawatts (MW) of solar were installed in Q2 2013.


Also worth of note is the clear fact that total solar power capacity in the US is set to surpass 10 gigawatts (10,000 MW) this year. Currently, the country is at 9,370. More likely than not, the 10 GW milestone will be passed sometime this quarter.
As noted in the title, solar panels installed across the US now have enough power capacity to power up to about 1.5 million average US homes. That’s impressive. That’s approximately enough to power Philadelphia or Phoenix, the country’s 5th- and 6th-largest cities.
In 2013 on the whole, about 4.4 GW of solar PV power capacity are projected to come online, about 30% more than in 2012. Yep, that’s a pretty huge chunk of the US total. And the reason? As I wrote above, solar panel costs have dropped a whopping 60% in the past 2.5 years or so.
Solar power is cheap!
Solar Is A Great Investment — Financially, Economically, & Environmentally
According to some analyses, the return on investment (ROI) from purchasing solar panels today beats the S&P 500 (on average) in 13 states and beats 5-year CDs (on average) in 43 states.
Plus, people realize that they are not only making money on these investments, but they’re also helping the climate (which we sort of need to remain livable), helping their local communities, and becoming more energy independent and energy secure.
Speaking of helping the local community, solar power now employs over 120,000 people across the US. That’s enough people to fill the cities of Athens (Georgia), Springfield (Illinois), Ann Arbor (Michigan), or Berkeley (California)… and more. Those 120,000 people are employed in 5,600 companies. Naturally, all of those stimulates local and state economies, as well as the US economy as a whole.
Why Solar Panel Costs Have Fallen So Much
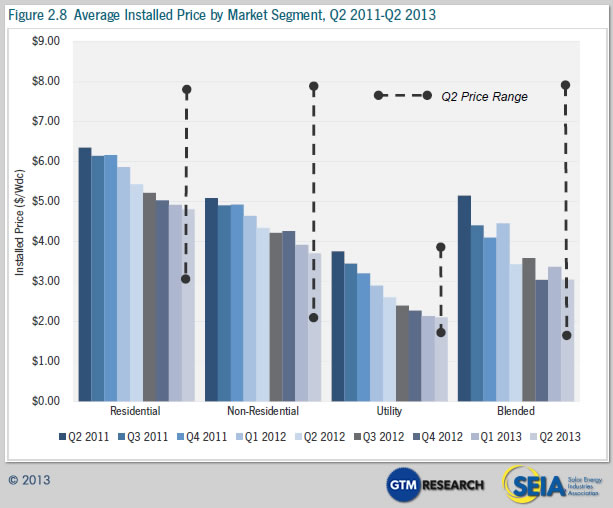
Solar panel costs and total installed solar power installation costs are down across market segments. “Quarter-over-quarter, the national average price declined by 9.3% from $3.36/W to $3.05/W, while dropping 11.1% from $3.43/W one year ago,” SEIA writes. “From Q2 2012 to Q2 2013, residential system prices fell 11.5% percent, from $5.43/W to $4.81/W. Quarter-over-quarter, installed costs declined by 2.2% percent. Installed prices came down in most major residential markets including California, Arizona, and New Jersey…. Non-residential system prices fell 14.7% percent year-over-year, from $4.35/W to $3.71/W, while quarter-over-quarter, installed costs decreased by 5.4%. States with SREC markets, such as New Jersey and Delaware, saw significant price declines since installers must continue to keep margins razor-thin given low SREC prices. Also of note, Pennsylvania’s non-residential system prices dropped by 13% quarter-over-quarter amidst its own fledgling SREC market and a state rebate program set to expire at the end of 2013.”
Solar panel costs are probably partly down due to technological and manufacturing advancements. However, the main driver of the reduction in installed solar panel costs is most likely just economies of scale (as more solar panels are produced, costs come down) and market maturation (as the market grows, competition grows — driving down the price of solar — and installers achieve economies of scale and cut their prices).
Naturally, as solar panel costs continue to drop, solar power grows even faster, which further brings down the cost of solar. (Thankfully, this is quite different from the situation with non-renewable fossil fuels, where greater use of fuel shortens supply and drives costs up over time.)
Here is projected US solar power growth for the coming few years:

I’m sure some of the solar power growth in Q2 2013 was from US homeowners who went solar through the Cost of Solar website. And I’m sure many more will go through our site in the future in order to find the best solar deal they can in their area. Perhaps you will be on of those new solar warriors?
Sign up for CleanTechnica's Weekly Substack for Zach and Scott's in-depth analyses and high level summaries, sign up for our daily newsletter, and follow us on Google News!
Have a tip for CleanTechnica? Want to advertise? Want to suggest a guest for our CleanTech Talk podcast? Contact us here.
Sign up for our daily newsletter for 15 new cleantech stories a day. Or sign up for our weekly one on top stories of the week if daily is too frequent.


CleanTechnica uses affiliate links. See our policy here.
CleanTechnica's Comment Policy