Why Hydrogen Transit Often Emits More Than Diesel Once You Count Everything
Support CleanTechnica's work through a Substack subscription or on Stripe.
The discovery, late in the year, that yet another hydrogen transit scheme turned out to be high emissions rather than low emissions was not surprising, but it was clarifying. The Dijon hydrogen bus project followed the same pattern seen repeatedly over the past several years. It was presented as zero emissions because the buses emitted only water vapor at the tailpipe. Once the full fuel pathway was examined, including production, processing, transport, storage, refueling, and leakage, the emissions picture changed completely. This was not a marginal effect. In Dijon, as in multiple other cases, the well to wheel emissions of hydrogen buses were comparable to diesel or materially higher. That prompted a review of the hydrogen transit emissions work already published over the past few years, this time applying consistent boundaries and including hydrogen leakage from the start rather than treating it as a later correction.
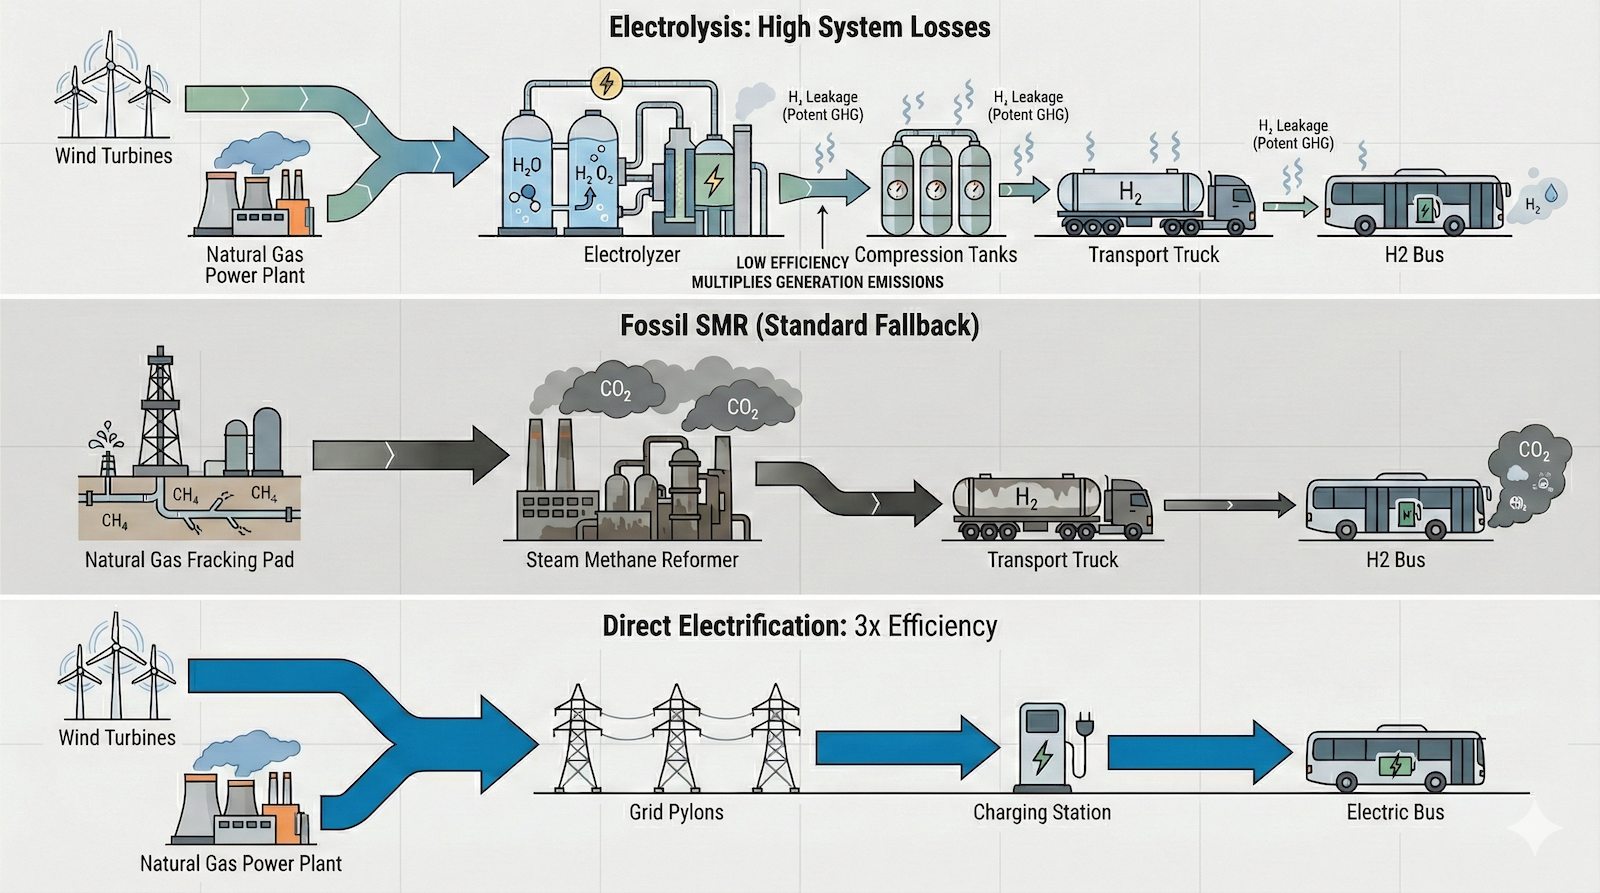
The foundational problem across hydrogen transportation policy has been the framing of emissions at the tailpipe. Hydrogen vehicles emit no carbon dioxide at the point of use, and that single fact was elevated into a proxy for climate performance. That framing migrated into grant programs, procurement scoring, and public communication across North America and Europe. Hydrogen buses were classified alongside battery electric buses as zero emissions vehicles despite fundamentally different upstream energy requirements. Once tailpipe emissions became the qualifying metric, upstream emissions were implicitly assumed away. This mattered because hydrogen does not exist as a natural transportation fuel. It must be manufactured, conditioned, transported, and stored, all of which require energy and all of which create emissions. Treating hydrogen as zero emissions at the tailpipe was not a minor accounting shortcut. It was the central distortion that allowed high emissions systems to be labeled as climate solutions.
Hydrogen transit schemes are also highly sensitive to the carbon intensity of the electricity used for electrolysis, and this sensitivity is often understated in project planning. Electrolysis requires roughly 50 kWh to 55 kWh of electricity per kg of hydrogen delivered to vehicles once compression and handling losses are included. On a grid emitting 400 g CO2e per kWh, which is typical of gas dominated systems, that results in roughly 20 kg to 22 kg of CO2e per kg of hydrogen before leakage. At 700 g CO2e per kWh, which is common on coal heavy grids or in marginal generation conditions, emissions rise to 35 kg to nearly 40 kg of CO2e per kg of hydrogen. A fuel cell bus consuming 8 kg to 10 kg of hydrogen per 100 km would then emit approximately 1.6 kg to 4.0 kg of CO2e per km on a well to wheel basis, several times higher than diesel.
Waste to energy electricity does not resolve this problem. Electricity from waste incineration typically carries carbon intensities in the range of 400 g to more than 700 g CO2e per kWh due to the fossil carbon content of plastics. Using such electricity to produce hydrogen compounds inefficiencies rather than reducing emissions, as the energy passes through incineration, power generation, electrolysis, compression, and fuel cell conversion. In these cases, hydrogen buses can emit multiples of diesel emissions per km while still being labeled zero emissions at the tailpipe.
When hydrogen transit schemes fail to secure electrolyzed hydrogen supply and instead fall back to gray hydrogen, emissions outcomes deteriorate rapidly and predictably. Gray hydrogen produced via steam methane reforming emits roughly 9 to 12 tons of CO2e per ton of hydrogen before distribution and leakage are included, based on widely cited industrial assessments. A typical fuel cell bus consumes on the order of 8 kg to 10 kg of hydrogen per 100 km, which translates to approximately 0.08 to 0.12 tons of hydrogen per 1,000 km of operation. At 10 tons of CO2e per ton of hydrogen, that results in roughly 0.8 to 1.2 kg of CO2e per km before accounting for compression, transport, refueling, and leakage. A modern diesel bus operating in urban service emits roughly 1.0 kg to 1.2 kg of CO2e per km including upstream fuel emissions. Once hydrogen compression, distribution energy, and even modest leakage of 2% to 4% are included, gray hydrogen buses routinely exceed diesel emissions on a well to wheel basis. In other words, the moment a hydrogen transit project relies on gray hydrogen, whether temporarily or permanently, it ceases to be a decarbonization measure and becomes an emissions regression that is often worse than the diesel fleet it was intended to replace.
Hydrogen leakage must be addressed before any case studies are examined. Hydrogen is the smallest molecule in common industrial use. It diffuses easily through seals, joints, valves, and materials that are effectively impermeable to larger molecules. Leakage occurs during production, compression, liquefaction, transport, storage, and refueling. Transit systems are particularly leakage prone because they involve frequent fueling events, high pressure storage, distributed infrastructure, and repeated mechanical connections. This is not hypothetical. Measurements from industrial hydrogen systems show leakage rates ranging from 1% to more than 10% depending on system design and operating discipline. Even at the low end of that range, leakage is material.
Hydrogen is also an indirect greenhouse gas. Atmospheric chemistry research over the past several years has demonstrated that hydrogen emissions increase warming by extending the lifetime of methane and increasing tropospheric ozone. Studies have estimated hydrogen’s global warming potential over 20 years in the range of 33 to 37 times carbon dioxide on a mass basis. Over 100 years, the warming effect is lower but still multiples of carbon dioxide. This means that leaking hydrogen has a climate impact that must be included in well to wheel accounting. Ignoring hydrogen leakage no longer reflects current science. For the purposes of this article, hydrogen leakage is included in all emissions calculations, using conservative assumptions toward the low end of published ranges.
A consistent methodology is necessary before comparing cases. Well to wheel emissions include fuel production, processing, transport, storage, refueling, and use. For marine vessels, the equivalent boundary is well to wake. Electricity emissions are based on grid averages where applicable. Diesel emissions include upstream fuel production and combustion. Hydrogen emissions include production pathway emissions, energy losses, and hydrogen leakage converted to carbon dioxide equivalent using published global warming potential values. Infrastructure manufacturing emissions are noted but not fully quantified where data is incomplete, which biases results slightly in favor of hydrogen rather than against it.
The Winnipeg hydrogen bus proposals provides one of the clearest numerical examples. Manitoba’s electricity grid is dominated by hydroelectric generation and has an average carbon intensity of roughly 1.3 g CO2e per kWh. Under an early concept, hydrogen would have been produced locally using electrolysis at a transit depot. In that hypothetical scenario, producing one ton of hydrogen using grid electricity would have resulted in roughly 0.1 tons of CO2e from electricity use. Adding compression, storage, and handling increased that to approximately 0.2 tons of CO2e per ton of hydrogen. Including a conservative 3% hydrogen leakage rate added approximately 0.2 more tons of CO2e per ton of hydrogen, resulting in a total of roughly 0.4 tons of CO2e per ton of hydrogen delivered to buses. Diesel fuel emits approximately 3.1 tons of CO2e per ton combusted. In this narrow and unrealized case, hydrogen would have reduced emissions by roughly 87% compared to diesel.
That scenario never happened. The capital cost of retrofitting the existing trolley bus garage for hydrogen safety, installing electrolyzers, compression equipment, and refueling infrastructure proved too high. Winnipeg Transit abandoned the electrolysis plan and pivoted to producing hydrogen by reforming methanol. That single change completely inverted the emissions outcome. Methanol contains about 12.5% hydrogen by mass. Producing one ton of hydrogen requires reforming roughly 2.2 tons of methanol. Steam reforming of methanol releases carbon dioxide directly and loses a substantial fraction of energy content. When upstream methanol production emissions, reforming emissions, and energy losses were included, hydrogen produced via methanol reforming emitted far more than diesel before leakage was considered. Adding the same conservative 3% hydrogen leakage pushed the well to wheel emissions to approximately 3.2 times those of diesel for the same bus service. The hydrogen buses would have emitted more than three times the greenhouse gases of the diesel buses they were meant to replace. Winnipeg canceled the hydrogen bus project entirely, not due to emissions which they seem to have been oblivious to but due to hydrogen bus and systems costs, and ultimately moved toward battery electric buses, using electricity directly rather than routing it through hydrogen.
Whistler, British Columbia provides another clear numerical case. Hydrogen buses were supplied with hydrogen produced in Quebec using low carbon hydroelectric power. The hydrogen itself was relatively low emissions at the point of production. The problem was logistics. Hydrogen was trucked roughly 4,500 km one way from Quebec to British Columbia in diesel powered tanker trucks. Each round trip covered approximately 9,000 km to deliver hydrogen that provided roughly 10,000 km of bus driving range. Transport energy alone consumed a large fraction of the hydrogen’s climate benefit. When trucking emissions, compression, storage, refueling, and leakage were included, the well to wheel emissions of the hydrogen buses approached those of diesel. Depending on assumptions, they ranged from slightly below diesel to modestly above diesel. Battery electric buses using British Columbia’s low carbon grid would have emitted an order of magnitude less. The hydrogen buses were withdrawn after the four-year trial, to reported jubilation among the transit agency’s staff.
Norway’s MF Hydra hydrogen ferry demonstrates that the same pattern extends beyond road transport. The ferry was supplied with hydrogen trucked approximately 1,300 km from Germany. Norwegian hydrogen production projects failed to reach final investment decision due to lack of offtakers, so imported hydrogen was used instead. The hydrogen was not produced with near zero emissions electricity. When production emissions, transport emissions, onboard storage losses, and hydrogen leakage were included, the well to wake emissions of the hydrogen ferry were approximately double those of the diesel ferry it replaced. This outcome occurred despite Norway’s strong renewable electricity profile because the hydrogen was not produced locally and because hydrogen supply chains imposed substantial energy penalties.
Dijon fits squarely within this established pattern. Hydrogen buses were procured under programs that emphasized tailpipe emissions. Hydrogen production and supply relied on centralized facilities and distribution networks rather than on-site generation with dedicated new electricity supply. Once upstream electricity emissions, distribution energy, and hydrogen leakage were included, the buses were not low emissions. Available data indicates that well to wheel emissions were comparable to diesel and in some operating scenarios higher. Dijon was not an anomaly. It was another confirmation of a recurring result.
Across these cases, several common drivers explain why hydrogen transit emissions repeatedly exceed expectations. Hydrogen is rarely produced where it is used. Transporting hydrogen requires either high pressure gas trailers or liquefaction, both of which consume large amounts of energy. Hydrogen infrastructure is capital intensive and often underutilized, which increases emissions per unit of fuel delivered. Leakage compounds at every stage of the supply chain. Each of these factors is routinely understated or ignored in published studies.
Many well to wheel and life cycle assessments of hydrogen transit systems rely on optimistic assumptions. Short hydrogen delivery distances of 100 km to 200 km are treated as typical. In reality, many projects rely on hundreds or thousands of kilometers of trucking. Electricity for electrolysis is often assumed to be 100% renewable without demonstrating additionality. Manufacturing emissions for fuel cells and high pressure tanks are assumed to decline rapidly without evidence that supply chains have decarbonized. Hydrogen leakage is frequently omitted or treated as negligible despite measured data showing otherwise. Each assumption moves results in a favorable direction. Taken together, they produce outcomes that do not match real deployments.
Locality, temporality, and additionality provide a useful stress test for hydrogen transit claims. Locality asks whether energy is produced where it is used. Hydrogen transit almost always fails this test because fuel is centralized and transported. Temporality asks whether energy is available when it is needed. Transit systems require fuel on fixed schedules, while renewable electricity is variable. Electrolyzers draw from the grid when buses need fuel, not when surplus renewable power exists. Additionality asks whether new clean electricity was built to supply hydrogen production. In most transit projects, hydrogen consumes existing low carbon electricity rather than adding new generation. Battery electric buses perform better on all three dimensions. They preserve locality by charging at depots, align with temporality by charging overnight, and often require no additional generation in systems with existing capacity.
Hydrogen leakage reinforces these conclusions. Even small leakage rates materially affect climate outcomes. A 3% leakage rate applied across a hydrogen supply chain adds roughly 0.2 to 0.3 tons of CO2e per ton of hydrogen depending on the global warming potential used. Higher leakage rates increase that impact proportionally. In systems where hydrogen already struggles to outperform diesel, leakage pushes results decisively in the wrong direction. Leakage also undermines claims that hydrogen can scale safely in distributed transportation applications where control is more difficult than in centralized industrial settings.
The persistence of tailpipe based policy frameworks allowed these outcomes to repeat. Hydrogen buses qualified as zero emissions vehicles regardless of how hydrogen was produced or delivered. Transit agencies responded rationally to incentives as written. The problem was not intent. It was metrics. Once upstream emissions, leakage, and energy losses are included, hydrogen transit no longer fits the category it was assigned.
With current knowledge, the results are consistent. Hydrogen is rarely a low emissions transportation fuel in practice. Real world transit deployments often emit as much as diesel and in several documented cases emit multiples of diesel on a well to wheel or well to wake basis. Published studies were optimistic because they assumed away logistics, leakage, and electricity system constraints. Atmospheric science now shows that hydrogen leakage contributes to warming. When numbers are assembled using realistic assumptions, hydrogen transit fails on emissions, not just on cost or complexity.
Sign up for CleanTechnica's Weekly Substack for Zach and Scott's in-depth analyses and high level summaries, sign up for our daily newsletter, and follow us on Google News!
Have a tip for CleanTechnica? Want to advertise? Want to suggest a guest for our CleanTech Talk podcast? Contact us here.
Sign up for our daily newsletter for 15 new cleantech stories a day. Or sign up for our weekly one on top stories of the week if daily is too frequent.
CleanTechnica uses affiliate links. See our policy here.
CleanTechnica's Comment Policy