


Support CleanTechnica's work through a Substack subscription or on Stripe.
The newly published white paper began with a question that persisted because of how clearly island systems expose the realities of energy. Can Hawaiʻi, an isolated archipelago with no continental grid behind it and a long dependence on imported fuels, build an energy system that is cleaner, more resilient, more affordable over time, and better aligned with island realities than mainland assumptions? The question matters because constraints sharpen thinking. There is no neighboring grid to absorb mistakes. There is no pipeline network smoothing out fuel flows. Every major decision has to stand on its own. I am not from Hawaiʻi, and questions of land, legitimacy, and community belong to Hawaiians. What this work contributes is narrower. It tests the arithmetic, infrastructure logic, and system boundaries to clarify what appears technically and economically possible.

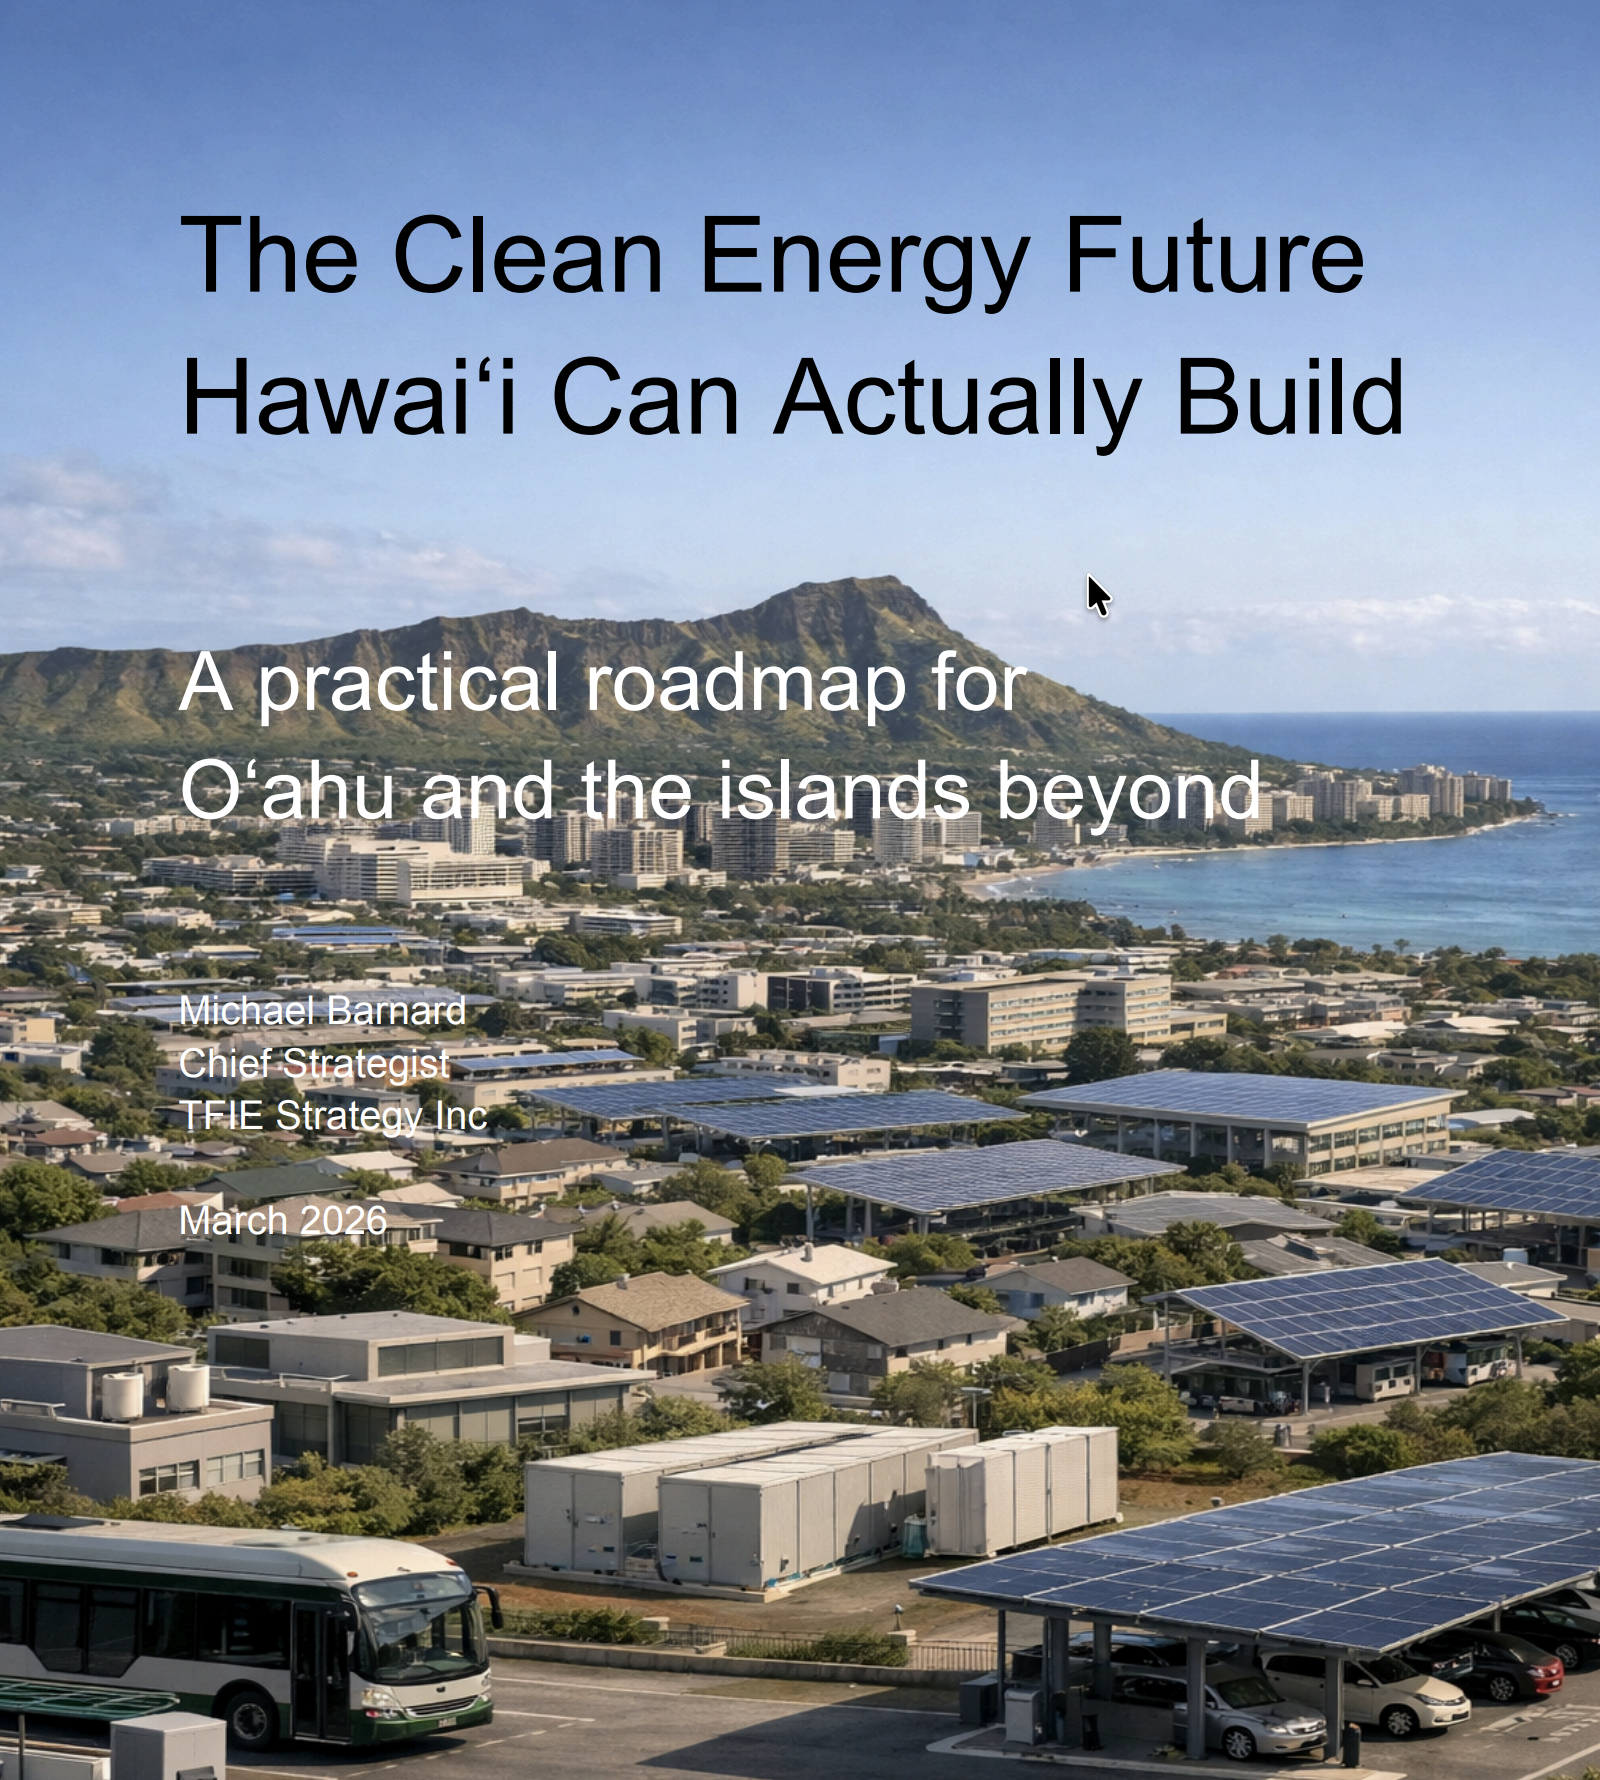
The full PDF is freely viewable and downloadable from this link: The Clean Energy Future Hawaiʻi Can Actually Build, A practical roadmap for Oʻahu and the islands beyond. While the white paper is based on explorations published in CleanTechnica, it has been extended from the original articles and edited into a coherent whole.
Hawaiʻi is often treated as a single energy system, but in practice it is a collection of electrically isolated island grids connected only by shipping. Oʻahu cannot balance Maui’s load. Kauaʻi cannot draw geothermal from Hawaiʻi Island. Each island must generate and balance electricity in real time while sharing a petroleum supply chain. Population and activity are concentrated on Oʻahu, with about 1.0 million of the state’s 1.44 million residents. Yet energy demand does not map cleanly to population. Oʻahu accounts for roughly 60% to 65% of statewide energy demand, not 70%, because aviation, tourism, and longer travel distances shift energy use toward the neighbor islands. Total statewide energy consumption is about 100 TWh per year, with Oʻahu responsible for about 62 TWh. Electricity is only about 7 to 8 TWh of that on Oʻahu. Transportation dominates at roughly 60% of total energy consumption. That imbalance is central to understanding the transition.
The first breakthrough is defining the problem correctly. Much of the energy associated with Hawaiʻi does not power the domestic civilian economy. Overseas aviation fuel, maritime bunkering, and military fuel use dominate the totals but are separate challenges. Removing those flows changes the scale of the problem dramatically. On Oʻahu, crude oil inputs fall from about 53,000 GWh to about 30,000 GWh when these categories are excluded. Transportation energy drops from over 34,000 GWh to about 14,000 GWh. The remaining system represents homes, businesses, local transport, and industry. It is large but manageable. This is not an accounting trick. It is aligning the system boundary with what local policy and infrastructure can influence.


Within that boundary, the second insight becomes clear. Most of the energy entering the system is wasted. In the civilian Oʻahu system, about 39,000 GWh of primary energy produces about 6,000 GWh of useful energy services. The remaining roughly 33,000 GWh becomes rejected energy, mostly heat from engines and power plants. Transportation alone converts about 20% of fuel energy into motion, with 80% lost. This is typical of combustion systems. The implication is straightforward. The transition is not about replacing every unit of fuel with a unit of clean energy. It is about delivering the same services with far less input energy.
Electrification is the mechanism that collapses demand. Electric motors convert about 70% of input energy into motion, compared to about 20% for internal combustion engines. Heat pumps deliver multiple units of thermal energy for each unit of electricity. Replacing a fleet that consumes 10,000 GWh of gasoline and diesel with electric vehicles can reduce energy demand to about 3,000 GWh while delivering the same mobility. Interisland shipping and aviation electrifies in the coming decades. Buildings shift from gas or oil to electric systems, with heat pumps drawing environmental heat into the system. Industrial processes shift toward electric motors and electric heat under 200 degrees Celsius. After full electrification of the civilian system, Oʻahu’s energy demand settles at about 6,000 GWh per year of electricity. That number is the foundation of the roadmap.
Once demand is defined, supply becomes clearer. Oʻahu has abundant solar resources. Utility-scale solar potential is about 1,862 MW after land-use constraints, producing about 3,700 to 4,000 GWh annually at a 23% capacity factor. Rooftop solar can add roughly 600 MW, producing about 950 GWh annually. The largest overlooked category is parking canopy solar. With about 2 million parking spaces and about 30 square meters per space, total parking area approaches 60 square kilometers. Covering 40% of that area yields about 24 square kilometers of canopy. At about 183 MW per square kilometer, this produces about 4,350 MW of capacity and about 6,900 GWh annually at an 18% capacity factor. Even halving that estimate still yields about 3,400 GWh. Additional contributions come from agrivoltaics at about 500 to 1,600 GWh, vertical panels at about 530 GWh, and redeveloped industrial land at about 530 GWh. Combined solar potential exceeds 10,000 GWh annually against a demand of about 6,000 GWh.


The system that emerges is not just solar. It is solar combined with storage and flexibility. Batteries shift energy from midday to evening. Demand management reduces peak load. Electric vehicles represent about 2,940 GWh of annual demand and about 8.1 GWh per day. Managed charging can shift 60% to 80% of that load into midday hours, reducing peak demand by 240 to 320 MW. Vehicle-to-home systems add another layer. With about 154,000 detached homes and average daily driving of 23 miles requiring about 7 kWh, vehicles can supply evening household loads of about 10 kWh. If half of those homes participate, about 770 MWh per day shifts from midday to evening, reducing peak demand by about 190 MW. Heat pump water heaters can shift another 50 to 70 MW. Combined, these measures flatten the load curve and reduce the need for additional generation and storage capacity.
The economics of this are no longer hanging on hope or on some future breakthrough. Over the past 15 years, solar and batteries have moved from expensive alternatives to low-cost infrastructure. IRENA reports that the global weighted-average cost of electricity from utility-scale solar fell from $0.46/kWh in 2010 to $0.044/kWh in 2023, a 90% decline, while solar module prices fell about 93% from the end of 2009 to the end of 2023. NREL’s 2025 solar industry update adds a more current marker, with global module spot prices sitting around $0.09/W in early 2025.
Storage has followed much the same path. IRENA reports that utility-scale battery energy storage system costs fell 93% from $2,571/kWh in 2010 to $192/kWh in 2024. BloombergNEF says average lithium-ion battery pack prices fell from about $1,474/kWh in 2010 to $108/kWh in 2025, with stationary-storage packs at $70/kWh in 2025.
That matters enormously for Hawaiʻi, because the state is not comparing these assets to some cheap local fuel base. It is comparing them to an imported energy system that pulled $8.58 billion out of the islands in 2023 after jumping to $9.29 billion in 2022. Solar panels and batteries do not need another tanker to cross the Pacific. They are bought once, operated for years, and paired with very low marginal cost electricity. At this point, the better framing is not that clean energy has become viable. It is that imported fuel dependence is becoming the more expensive option.
Firm capacity remains necessary but small. Biomethane from wastewater, landfill gas, and food waste provides about 4 to 6 million therms annually, equivalent to about 145 GWh of methane energy. At 45% conversion efficiency, this yields about 65 GWh of electricity per year, about 1% of total demand. This is not a primary energy source. It is a strategic reserve. At a 300 MW shortfall, 65 GWh provides about 9 days of supply. That is sufficient for rare events. It avoids the need for large fossil fuel systems designed for continuous operation.
Several elements fall away under this framing. LNG becomes unnecessary for the domestic electricity system. Once electrification and renewables are in place, there is no large combustion gap to fill. The waste disposal electrical generation plant H-POWER produces about 340 GWh annually but emits about 0.88 tons of CO2e per MWh due to fossil-derived waste. That is comparable to coal. Replacing its output requires about 170 to 200 MW of solar capacity and about 0.5 to 1.0 GWh of storage, which is modest within the broader system. Waste management becomes the primary issue, not energy supply.
Extending the analysis across the islands shows the same logic with different proportions. Hawaiʻi Island benefits from geothermal providing about 19% of generation today and potentially more. Maui has stronger wind resources, with about 16.5% of its mix from wind. Kauaʻi uses hydro and batteries to reach over 50% renewables and operates at 100% renewables at times. Smaller islands like Molokaʻi and Lānaʻi have tighter operating margins and require more careful balancing and retained firm capacity. The architecture remains consistent. Electrify demand. Build around local renewables. Add storage and flexibility. Adjust the mix to local conditions.
The grid transition is as important as the generation transition. Fossil plants provided inertia, voltage support, and fault current as a byproduct of combustion. In a renewable system, these services must be engineered. Grid-forming inverters, batteries, synchronous condensers, and reactive power devices replace these functions. Kauaʻi demonstrates this by operating with renewable generation supported by synchronous condenser mode and grid-forming controls. Maui is emerging as a test case for high inverter penetration. The transition is from accidental stability to designed stability.
Beyond the domestic system, the remaining challenges are long-haul aviation and ocean shipping. Shipping can transition to hybrid systems using batteries and low-carbon fuels such as methanol. Fuel costs are spread across cargo, limiting economic impact. Aviation remains more difficult. Long-haul flights require dense liquid fuels, and sustainable aviation fuel will be more expensive than conventional jet fuel. Hawaiʻi will import and handle these fuels rather than produce them locally. Biomethane is too small to contribute meaningfully to these sectors.
The economics reinforce the transition. Hawaiʻi spends about $8.6 billion annually on energy, with $4.6 billion in transportation alone. Fuel volatility increased spending by about $2.95 billion between 2021 and 2022. Electricity prices are about $0.40 per kWh on Oʻahu, with about 50% tied to fuel costs. Replacing imported fuels with local solar and storage shifts spending from volatile imports to stable assets. Solar costs have fallen by over 80% for utility-scale systems since 2010. Battery costs continue to decline. The transition is not an added cost. It is a redirection of existing spending.
The barriers are not technological. They are social, institutional, and financial. Land use, regulatory friction, and affordability perception are the primary constraints. Oʻahu’s solar potential can drop from 3,300 MW to 270 MW under strict land constraints. Interconnection delays and unclear rules slow deployment. Households must see cost benefits early to support the transition. Demand management, rooftop solar, and distributed storage must be accessible to renters and multifamily residents.

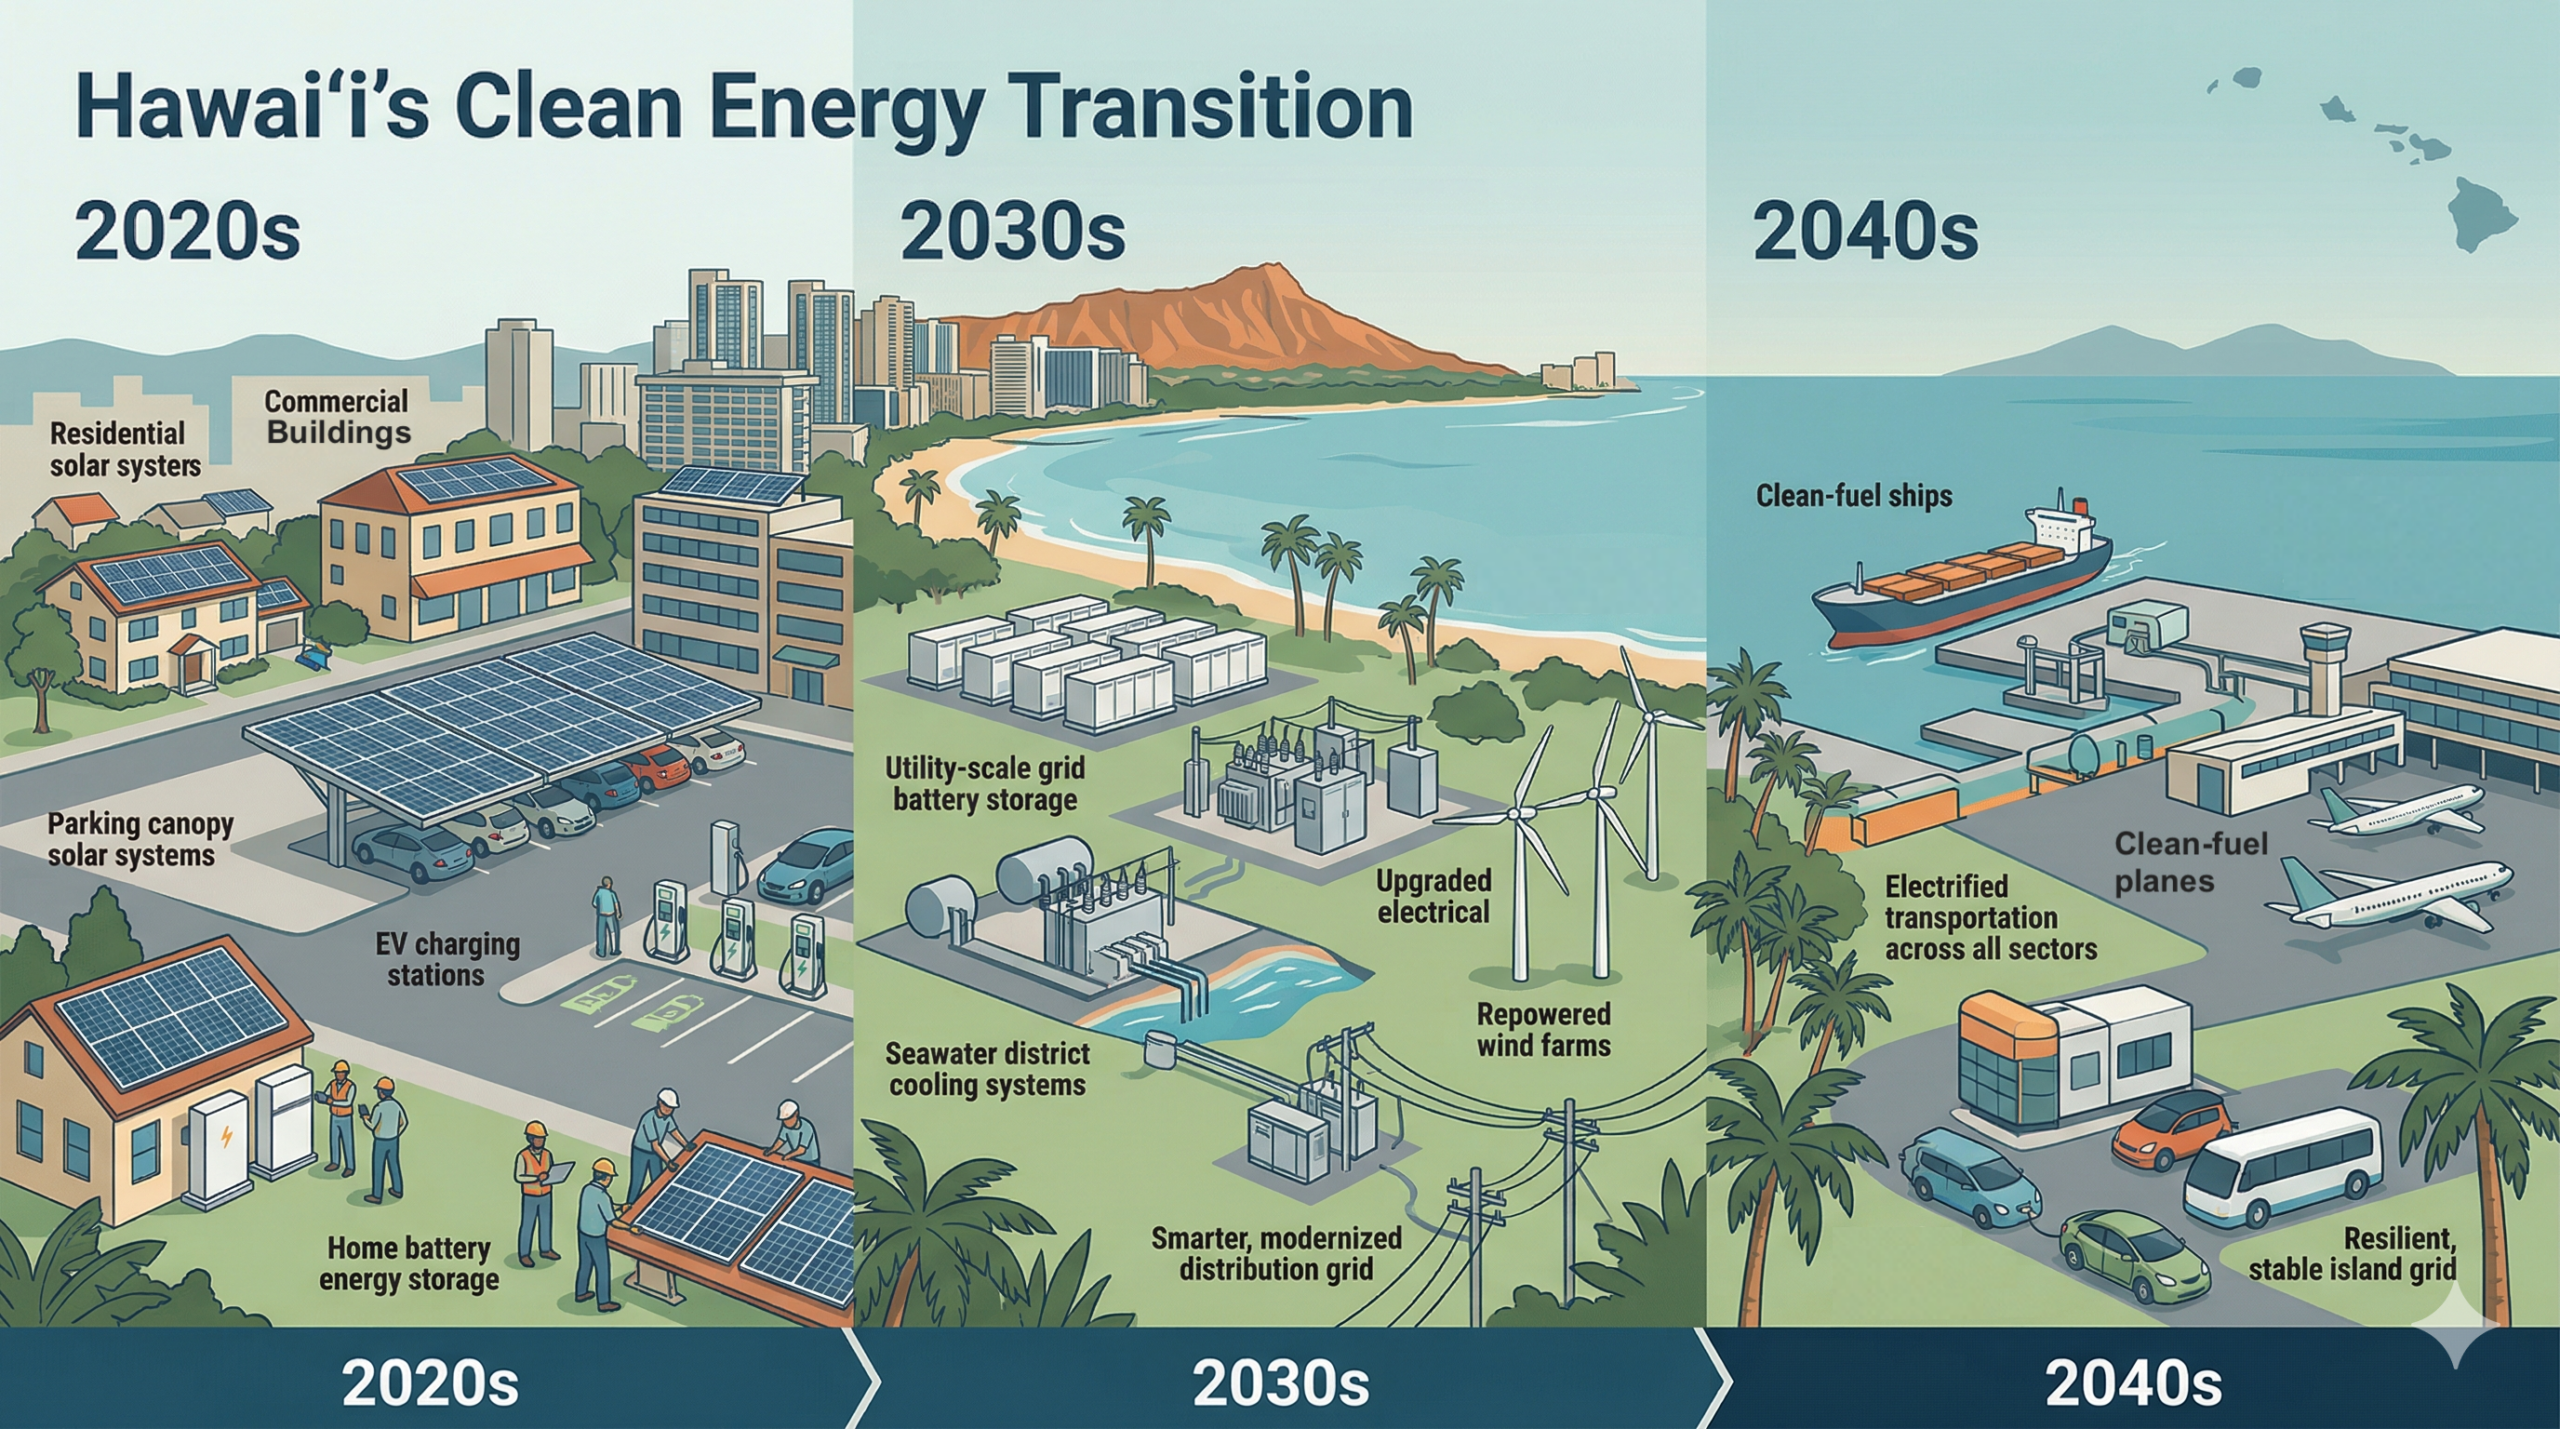
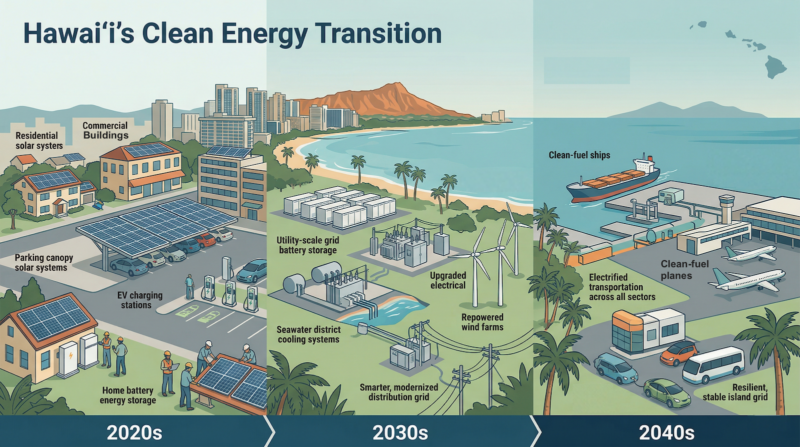
The roadmap is structured in phases. Through 2030, the focus is on removing deployment friction and building the no-regret stack of solar, storage, and flexible demand. Through the 2030s, oil-fired generation is retired and the system reaches near-zero carbon for domestic electricity. Through the 2040s, the focus shifts to long-haul fuels, system resilience, and asset replacement. At each stage, policy, technology, infrastructure, finance, and workforce development must align.
The final picture is coherent. Oʻahu’s domestic energy system becomes an electrification problem rather than a fuel problem. Solar supplies most energy. Batteries and flexible demand shape it across time. Wind adds diversity. Biomethane provides a small reserve. Long-haul transport is treated separately. LNG has no meaningful role. The system reduces dependence on imported fuels, lowers long-term costs, and increases resilience. The arithmetic shows what is possible. The choices about how to proceed remain with Hawaiʻi.
Sign up for CleanTechnica's Weekly Substack for Zach and Scott's in-depth analyses and high level summaries, sign up for our daily newsletter, and follow us on Google News!
Have a tip for CleanTechnica? Want to advertise? Want to suggest a guest for our CleanTech Talk podcast? Contact us here.
Sign up for our daily newsletter for 15 new cleantech stories a day. Or sign up for our weekly one on top stories of the week if daily is too frequent.

CleanTechnica uses affiliate links. See our policy here.
CleanTechnica's Comment Policy