The State(s) of Distributed Solar — 2018 Update
Originally published at ilsr.org.
2018 Year-End Update
Renewable energy continued to expand across the country in 2018. This expansion in renewable energy complements a growing number of states, utilities, and cities that have set ambitious goals to transition to 100% renewable and carbon-free power generation.
New solar photovoltaic capacity, including from small-scale distributed solar systems (such as arrays on the rooftop of a home or business), shared community solar gardens, as well as larger utility-scale systems, has played a significant role in the overall transition to clean energy.
A growing number of states are making investments in solar a priority.
The following map illustrates the size of each state’s solar market at the end of 2018 with pie charts that show the corresponding share of smaller distributed solar systems (1 megawatt and smaller). Exploring this map, we can see which states have the largest shares of distributed solar, investments that help build wealth locally and allow individuals and communities to take greater ownership over their energy future.
In this year’s map, we have added a snapshot of data from Minnesota’s leading community solar garden program to flag this program’s success and illustrate an alternative model to larger-scale solar projects that does not defer entirely to incumbent utility ownership.
Since community solar systems are typically larger than 1 megawatt of rated capacity, we plan to begin tracking and disaggregating similar data in the growing number of states that have passed similar policies enabling or requiring robust shared renewable programs (as of 2018, 18 states and the District of Columbia have done so to varying degrees). This will allow us to include community solar capacity in future analyses of the country’s solar market.
For more information on state community solar and renewable energy programs, explore our interactive Community Power Map. Learn more about what makes these programs successful by reading our in-depth report on the topic entitled Beyond Sharing: How Communities Can Take Ownership of Renewable Power.
Total Solar and Percent Distributed by State — 2018
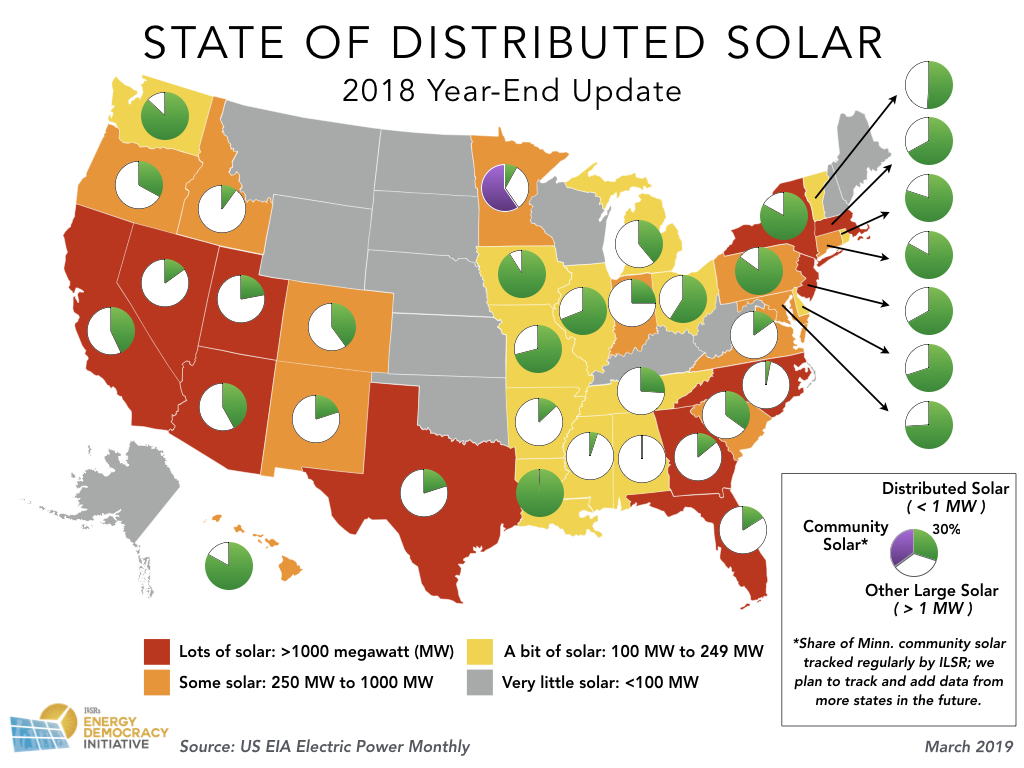
As this map illustrates, a greater number of states than ever are making solar a priority. As of 2018, 11 states now claim more than 1000 megawatts of total solar capacity (shown in red), and 37 have more than 100 megawatts (states shown in yellow, orange, and red).
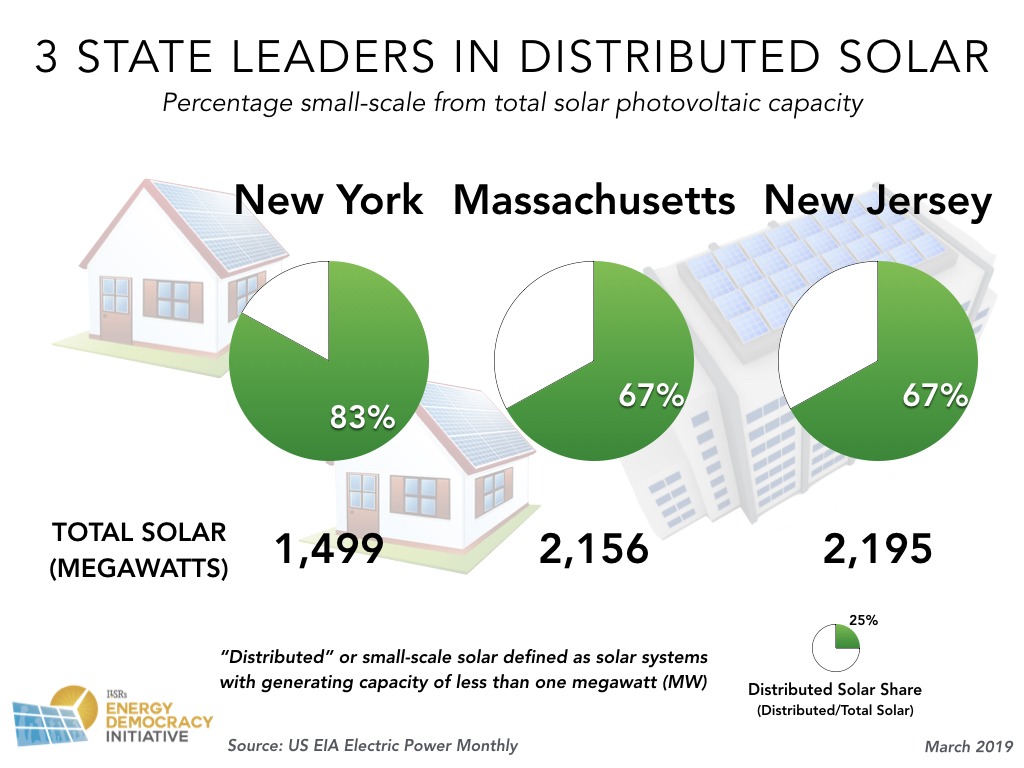
Of the 11 states that now contribute more than 1000 megawatts of solar power, three leaders continue to boast shares of distributed generation greater than 50%: New Jersey (2195 megawatts of total solar, with 67% from small-scale sources), Massachusetts (2156 megawatts, also with 67% from small-scale), and New York (1499 megawatts of total solar), where 83% of total solar comes from small, distributed sources.
Established solar markets are not the only ones to have seen success.
Burgeoning distributed solar markets in Midwestern states like Ohio and Illinois have also benefited from policies that support greater access and more local control of energy infrastructure. Residents of Athens, Ohio, for example, have been working to support great investment in clean energy by exercising community choice, which state policy has helped enable. Illinois has seen rapid growth in its solar market since passage of its sweeping Future Energy Jobs Act in 2016. The state has supportive net metering and interconnection rules that encourage distributed energy and is developing a shared renewable energy program to increase access to solar among renters and households or businesses that may have shady rooftops. Such policies helped the state receive an “A” grade in ILSR’s 2019 Community Power Scorecard.
In general, we find that those states with policy landscapes that are more supportive of local energy decision-making typically see a greater percentage of distributed solar, which further benefit communities by building wealth locally and allowing communities to take more ownership in their clean energy future.
Unfortunately, not all states have policies in place that make it easy to invest in distributed and shared solar systems. We see this playing out in the number of states that rely more heavily on larger and utility-scale solar systems, relative to small-scale distributed solar.
Read more about why state energy policies matter when it comes to enabling local renewable energy, in our recent companion analysis to ILSR’s 2019 Community Power Scorecard. Stay-tuned for a future in-depth comparison between states’ distributed solar capacity and their scorecard performance, as well.
In a majority of states in 2018, large utility-scale solar projects claimed more total solar capacity overall and a greater share of that total. These larger scale solar projects require more capital upfront, more time to construct, and are typically left to investor-owned utilities to operate and manage.
Is bigger best? ILSR’s 2016 report skewers the myths and shows how small-scale solar provides a competitive alternative to utility-provided electricity, and much larger local benefits.
Many of these same utilities are actively involved in tilting the playing field to their favor by fighting a future of greater customer choice and control. Recently, legislators in New Mexico have considered a bill giving handouts to one of the state’s incumbent utilities and that risks shutting out local ownership from future renewable energy investments.
Is the future energy monopoly or energy democracy? States have an important role to play in determining which path communities ultimately choose.
This States of Distributed Solar analysis is updated annually. For a historical snapshot, explore our archived analyses of distributed solar by state in 2017 and 2016. Stay-tuned for a future in-depth comparison between states’ distributed solar capacity and their scorecard performance, as well.
This article originally posted at ilsr.org. For timely updates, follow John Farrell or Marie Donahue on Twitter or get the Energy Democracy weekly update.
Have a tip for CleanTechnica? Want to advertise? Want to suggest a guest for our CleanTech Talk podcast? Contact us here.
Latest CleanTechnica.TV Video

CleanTechnica uses affiliate links. See our policy here.