Sparking Grid Savings At Home Report: Part 2 — Deepening Of Peak Energy Reduction In Homes
Read the full report here.
Deepening of Peak Energy Reduction in Homes
While most programs so far have targeted home comfort (central air conditioning or electric water heating), there are other sources of electricity consumption that remain untouched.
Read the full report, Report: Sparking Grid Savings Starts at Home, here. Stay tuned later this week for the second and final part.
The following table shows numerous power draw estimates for common household appliances whose operation could be time-shifted during periods of high energy draw. Energy savings from dishwashers and clothes washers may already be captured in programs where customers pay more for electricity during peak periods, but refrigerators and window air conditioning units run on their own schedule.
Typical Energy Consumption of Large Household Appliances (Watts)
| Data Source: | Reference.com | Don Rowe Inverter Company | Chabot Space & Science Center | Consumer Reports | ILSR Estimate |
| Refrigerator | 600 | 500-750 | N/A | 725 | 600 |
| Dishwasher | N/A | 1,200 | 1,200-1,500 | 1,800 | 1,200 |
| Clothes washer | 500-1,000 | 500 | 500 | 425 | 500 |
| Window A/C units | 1,000-1,500 | N/A | 1,000 | 1,000 | 1,000 |
Using the lower-end estimates for each, we could expect controlling refrigerators to provide around 600 watts, dishwashers 1,200 watts, clothes washers around 500 watts, and room air conditioners around 1,000 watts of power.
Of course, not all these items are available all the time. But the time we most need them is the time of peak energy demand. For this illustration, we’ll use Dakota Electric in Minnesota, a utility with an electricity system that reaches peak use in the summer, between 4 p.m. and 9 p.m.
We can probably assume that almost every household (99%) has access to a refrigerator and clothes washer. Dishwashers are in about 75% of American homes, while 91% of Midwest homes have air conditioning. About 22% of air conditioned homes (around 20% of total homes) use window units.
So let’s say a Minnesota utility wanted to manage energy demand in 10,000 homes in Minneapolis. The following table shows how many available appliances the utility would have at its disposal, at a maximum, and the total megawatts of capacity.
Maximum Number of Available Controllable Appliances and Capacity (10,000 households)
| Appliance | Number | Total Megawatts |
| Refrigerators | 9,900 | 5.94 MW |
| Dishwashers | 7,500 | 9.00 MW |
| Clothes washers | 9,900 | 4.96 MW |
| Window A/C units | 2,200 | 2.20 MW |
Of course, just because a customer has the appliance does not mean it would be on. Newer refrigerators use smaller compressors that run 80% to 90% of the time. We’ll assume 80% of refrigerators are available to cycle (about 4.7 MW). Dishwashers are much less certain, with the average dishwasher running just one cycle every 3 days. The wash/dry cycle takes about an hour, so in the 4 p.m. to 9 p.m. timeframe, we can only assume we’ll have 1 in 6 dishwashers running at all (assuming half are running in our peak time window), and only 20% of those available each hour (0.3 MW).1 Clothes washers are used more frequently — the average American does 400 loads per year, so the typical washer is running 1.1 times per day. We’ll assume half of laundry loads are done between 4 p.m. and 9 p.m., and that each individual cycle takes one hour. Thus, in a given hour we would have 11% of washers available to control (0.55 MW). Because we’re talking about peak energy times, it’s probably hot out, so we’ll assume 90% of window A/C units are running the full 5 hours (1.98 MW).
Cycling appliances frequently is bad for the compressor (where applicable), so we’ll assume the utility taps at most 20% of available units each hour to cover the entire peak demand period.
Estimated Available Capacity from Controllable Appliances (10,000 households)
| Appliance | Number | Total Megawatts | Total % Available | Available Megawatts | Available Megawatts per hour (20%) |
| Refrigerators | 9,900 | 5.94 MW | 80% | 4.7 MW | 0.94 MW |
| Dishwashers | 7,500 | 9.00 MW | 03.3% | 0.3 MW | 0.06 MW |
| Clothes washers | 9,900 | 4.96 MW | 11% | 0.55 MW | 0.11 MW |
| Window A/C units | 2,200 | 2.20 MW | 90% | 1.98 MW | 0.40 MW |
| TOTAL | 1.51 MW |
We’re left with 1.51 MW of controllable energy demand per 10,000 households. It may seem small, but in a city like Minneapolis with 166,000 households, the utility has 25 megawatts of untapped energy supply, or about 4% of total peak energy demand.
So how could Xcel Energy or another utility start capturing this potential?
Powerful Examples
California utility PG&E offers a market-based automated demand response program, with payments ranging from $200 to $400 per kilowatt of load reduction. For comparison, the owners of the five buildings participating in the pilot program in the Northwest could have earned a minimum of $153,000 for participation in the PG&E program, in addition to their reduced energy bills. Our hypothetical 10,000 Minneapolis households, if grouped together, could have each earned up to $76 had they been participating in the PG&E program.
SDG&E, also in California, offers a similar automated demand response program with incentives worth up to $300 per kilowatt of demand reduction. While 60% of the incentive depends upon completion of the project and test of its load reduction potential, 40% is based on actual performance during the year.
Minnesota Valley Electric Cooperative’s Energy Wise demand response program has automated and manual components. The utility provides a free smart thermostat that allows it to automatically control cooling and heating during peak energy events. The 44% of customers who participate receive a 10% discount on electricity during summer months. In exchange, the utility pre-cools the house by two degrees in the morning, and allows temperatures to rise by up to 4 degrees five to seven times per month.
The cooperative’s program goes further, encouraging customers to form teams to beat the peak. The highest-performing teams can win gift cards and prizes, and are notified of peak energy events via email, text, or phone the day prior.
 The good news is that these successful programs don’t require advanced or smart meters, which have yet to replace older meters for 50% to 75% of customers across the country, including all of Xcel Energy’s Minnesota customers. Energate, one of many companies in the “connected home” space, offers utility programs that simply pair smart devices with an Internet connection — no smart meter required. That could be a significant tool in Minneapolis, where, like many other large cities, over 90% of households have access to a wired, broadband Internet connection (and the city has a citywide Wi-Fi provider).
Weather forecast company WeatherBug offers forecasting analytics as a tool to enhance the savings from smart, connected thermostats. In a Texas trial, smart thermostats using the company’s integrated weather analysis were able to increase peak energy savings by 13% per home.
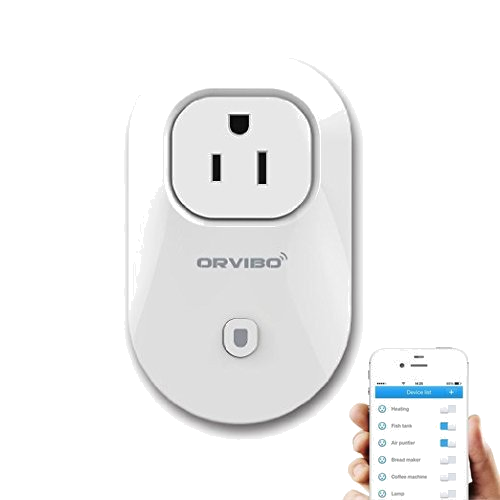
Automation technology is available off the shelf today. The Orvibo smart outlet plug (shown right), for example, lets customers set a schedule or turn the device on and off from anywhere via a wifi connection. There are dozens more choices, many available for less than $50. These devices are compatible with large appliances and could be deployed as part of utility demand response programs.
Automated or No?
Of the four appliances we considered, there are two distinct types. Refrigerators and air conditioners run independently, turning on and off automatically based on their thermostat settings. Interrupting the cycle of a refrigerator or air conditioner is a minimal inconvenience, and can be done remotely without the customer even noticing it’s happening. Central air conditioners are already controlled in this fashion by utilities, but smart outlets could allow utilities to control automatic appliances like refrigerators and window air conditioners, too.
The other kind of appliances — in this case, washers and dishwashers — run manually, typically starting when a human interacts with them. Trying to stop a washer or dishwasher mid-cycle may reset the machine or cause it to fail to complete its task.
In other words, automating demand response may only make sense for the automatic appliances. For appliances run manually, requiring human interface, it may make sense to instead change human behavior. This may be done more effectively by using transparent pricing communicated through talk, text, or social media, as is done in the Energy Wise program. It can be aided by timers built into these appliances, such as dishwashers or clothes washers that can be scheduled to run at a later time.
For manual appliances, there’s also an opportunity to use psychology to obtain savings. Opower has teamed up with many utilities to put smiley or frowny faces on monthly electric bills to motivate customers to use less energy than their neighbors. The strategy has helped reduce energy use, some of which overlaps with peak demand periods.
Conclusion
Homes and businesses represent a large source of manageable energy consumption. Decades-old utility programs enable control of a few major sources of household or business energy use, but much untapped potential remains. In one city, Minneapolis, controlling four major household appliances in homes across the city could reduce peak energy demand by 4%.
Utilities can use commercially available smart technology to allow themselves or their customers to cycle automatic appliances — refrigerators and window air conditioners — and reduce peak energy consumption. Transparent pricing based on the actual costs of electricity can motivate customers to shift the time they use manual appliances such as washers and dishwashers, further reducing peak energy demand.
Electric utilities should explore programs for residential and commercial demand response to access this abundant, low-cost source of peak energy supply.
Footnotes
- We’re obviously simplifying dramatically, since there’s likely a bias toward dishwashers or clothes washers running later in the evening for working families, or at different times of day entirely.
For timely updates, follow John Farrell or Karlee Weinmann on Twitter or get the Energy Democracy weekly update.
Have a tip for CleanTechnica? Want to advertise? Want to suggest a guest for our CleanTech Talk podcast? Contact us here.
Latest CleanTechnica.TV Video

CleanTechnica uses affiliate links. See our policy here.