Further Thoughts On The Economics Of Losing The Federal Solar Tax Credit
Originally published at ilsr.org.
Amid the discussion over ending the federal solar tax credit in 2015, I published an analysis of the less-than-expected hit to residential solar costs.
I made a big mistake. Instead of a 2.5% cost increase, the impact of the expired tax credit would be closer to 13.3%. But a revised and deeper investigation also shows our perverse reliance on tax incentives inflates the cost of solar by 20% or more.
First, let’s talk about my error. The crux of the issue is that tax equity partners — the ones needed to secure tax credits — have very high return requirements, compared to a bank or other typical lender. In my initial analysis, I made a couple of significant errors:
- The analysis looked at a residential solar project. Although tax equity deals underlie much of the solar leasing market, I looked at a single project whereas the deals in the leasing market would be spread over hundreds of projects.
- I assumed that a relationship with a tax equity partner would increase the cost of debt, but not change the amount of debt.
Here’s the original chart, showing that I incorrectly compared debt costs, rather than factor in the role of tax equity partners in lowering capital costs.

Knowing the errors I made, what can we say about the impact of a tax credit expiration? Let’s re-do this analysis in a way that mimics how these deals actually get done.
In a $2.5 million, 1-megawatt solar project, a tax equity partner provides upfront cash in exchange for the depreciation and tax credit benefits plus a small portion of project revenue during the project’s tax life (~7 years). In this case, the partner provides 40% of project cash, or $1 million, and in return receive $1.4 million in tax benefits, about $133,000 in project revenue, and a $250,000 buyout.
In the chart below, the leftmost blue bar illustrates the cost of electricity from this Tucson, AZ, based solar project, while the other two blue bars show the cost in the unlikely circumstance that the tax equity partner provided 45% or 50% of project capital, respectively. The bars also show very high annual returns on investment for the partner, especially given that more than 90% of their revenue is essentially zero risk, requiring only that the project get built and not that it produce any power.

So what happens without the tax incentives? The leftmost green bar in the following chart shows the cost of electricity (about 13% higher) from a project that can’t access the tax credit. We also assume that such a project can’t monetize the depreciation on an accelerated schedule, but instead depreciates the project over 15 years.
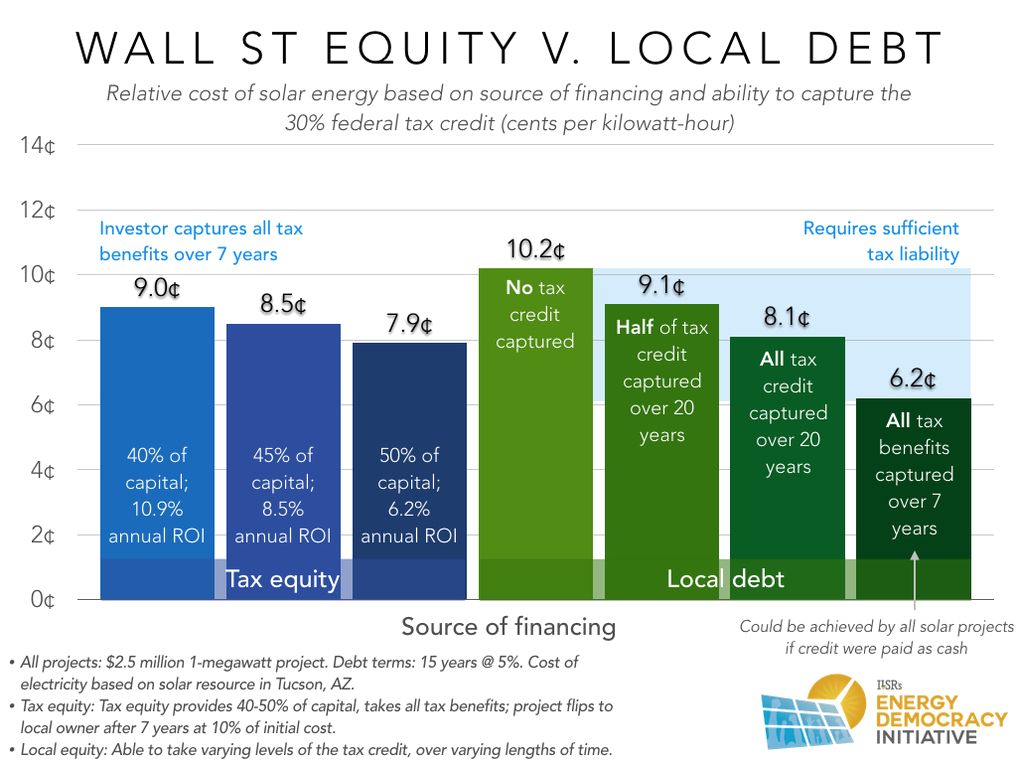
So rather than my claim of a 2.5% cost increase from the loss of the tax credit, the more accurate figure is about 13%. Still, that is far less than the 30% tax credit value because losing the tax credit invites an opportunity to look for backers beyond the Wall Street firms that take a big cut.
The chart’s other green bars show that if the tax benefits could be captured by local projects instead of requiring Wall Street partnerships, project costs could fall substantially. For example, if a local project could capture just half the tax credit value, it would approach price parity with a typical tax equity deal where a partner provides 40% of project capital (9.1¢ v. 9.0¢). If a local project could capture all the tax credit for a cost of 8.1¢ per kilowatt-hour, it would compete even with the unlikely Wall Street banker willing to take a 6.2% return on investment (ROI). And if the local project could capture the tax benefits on the same schedule as a Wall Street firm (or if the tax credit and depreciation benefits were provided as cash instead of a tax write-off), it would lower the cost of solar electricity by a minimum of 22%, and as much as one-third.
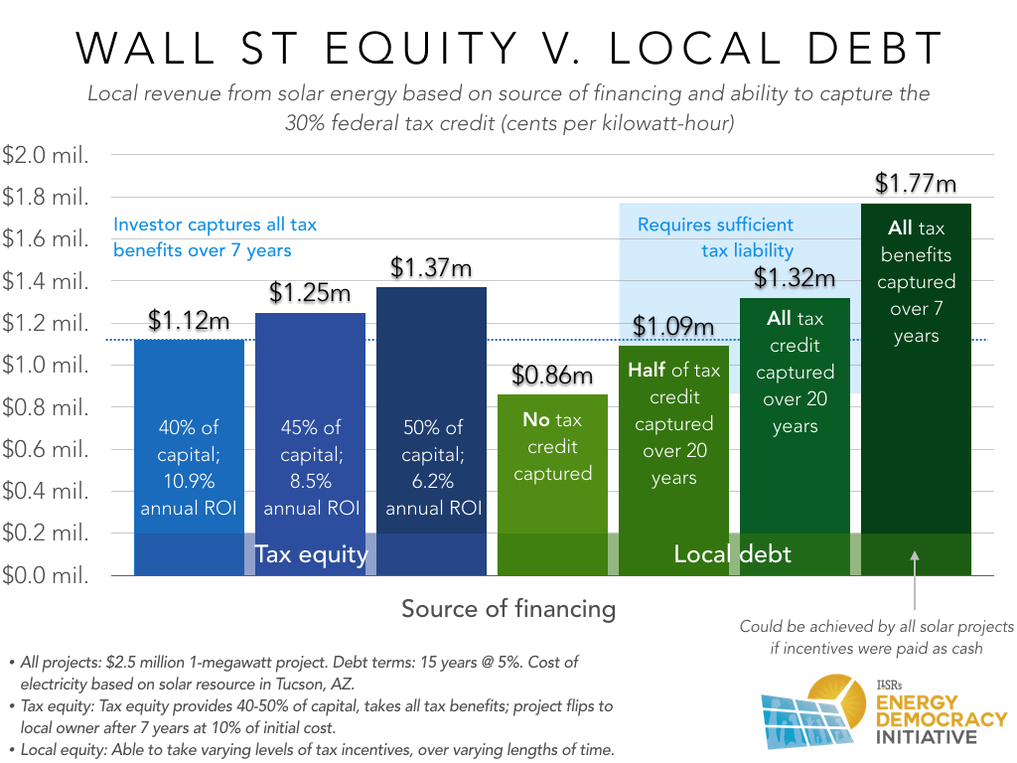
Not only would dropping Wall Street lower project costs, but local revenue would increase. The following chart shows that, on a level playing field, local projects would generate $200,000 to $600,000 more in local revenue over a 25-year project life than a typical tax equity deal. Even if tax equity partners could be persuaded to provide half of project capital, the cost to local investors would be $400,000 less if the same financial benefits could be awarded without requiring a Wall Street partner.
I made a mistake in my initial analysis, overlooking two key distinctions in the role of tax equity that lowers project costs. But in the big picture, the more costly mistake is to continue using the tax system to provide renewable energy incentives, generating substantial low-risk returns for Wall Street instead of Main Street while increasing the cost of supplying solar energy.
For timely updates, follow John Farrell on Twitter or get the Energy Democracy weekly update.
Photo credit: Emily via Flickr (CC BY-NC-ND 2.0 license)
Have a tip for CleanTechnica? Want to advertise? Want to suggest a guest for our CleanTech Talk podcast? Contact us here.
Latest CleanTechnica.TV Video

CleanTechnica uses affiliate links. See our policy here.