City Power Play — Part 3: City Policies Matter
Originally published on ilsr.org.
Below is part three of our City Power Play report, a report released in October 2013 (and still relevant today) about the types of policy solutions cities can enact to increase their ownership of renewable energy. Read part 1 and part 2, published last week.
Permitting
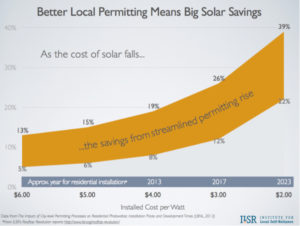 One authority almost all cities retain is the power over zoning and permitting for renewable energy installations, and practices vary widely. Perhaps unexpectedly, permitting costs can make up a very significant portion of the installation cost of a renewable energy project, like rooftop solar, especially as the cost of solar energy continues to decline.
The graphic on the right (click to enlarge) illustrates that best practices in permitting cut the cost of a 2011 residential solar installation by 5–13%, but could reduce the cost of a solar project installed 10 years from now by nearly 40% because, as solar prices decline, soft costs like permitting take up a much larger share of total costs.
The best city policies make permitting simple and inexpensive, offer online applications with quick turnaround, are harmonized with other regional permitting policies, and minimize inspections.
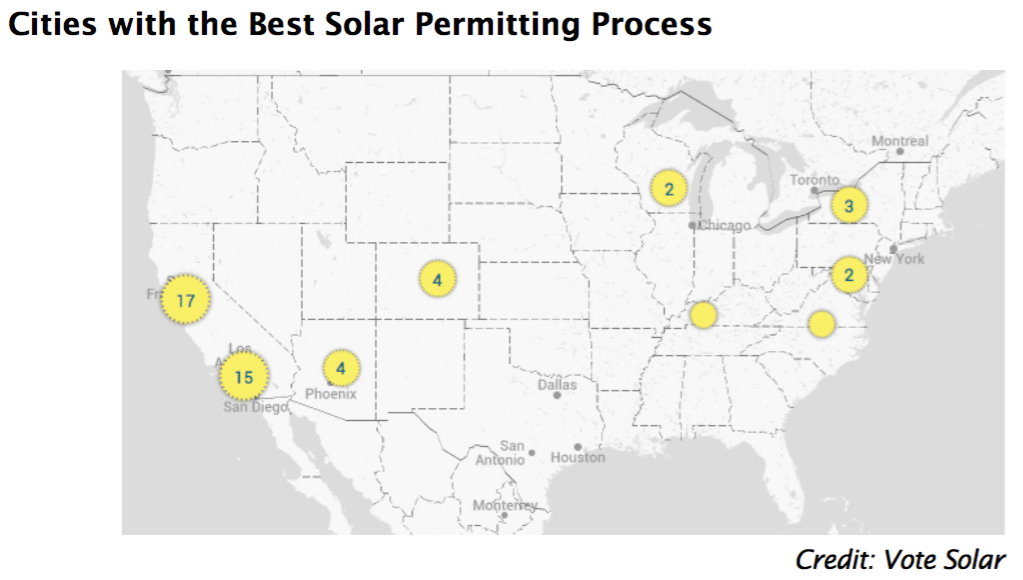
Vote Solar’s “Project: Permit” has an interactive map that shows the communities with the best policies, including Madison, WI; Pueblo County, CO; and Davidson County, TN. View the map at projectpermit.org.
The criteria for a better permitting process on their map includes:
- Posting permitting requirements online
- Allowing online permit processing
- Fast turn around time (1–3 days)
- Reasonable, cost-based permitting fees
- No community-specific licenses required (use state licensure requirements)
- Narrow inspection appointment window
- Eliminating excessive inspections (1 only)
Energy Disclosure Ordinances
When shopping for a home or office, prospective buyers are often in the dark about a building’s energy use. Cities have come to the aid of buyers, enacting rules requiring building owners to disclose standardized energy usage metrics.
Several cities and states started over a decade ago with disclosure requirements for public buildings, but a few pioneering cities have had policies for private buildings for years. Chicago, IL, for example, has required residential rental property owners to disclose heating bills to prospective buyers since 1987.77 Montgomery County, MD, requires all residential property owners to disclose heating and electricity bills for the prior 12 months to prospective buyers.78
In recent years, the effort to make energy a part of the building purchase decision has spread, helping create a market for more energy-efficient buildings.
A common strategy is to require larger commercial buildings to disclose energy and water use using the Environmental Protection Agency’s (EPA) Energy Star Portfolio Manager, already home to benchmarking data for 40% of US commercial building space.79 The table below shows the cities that have enacted energy disclosure ordinances, the types of buildings the existing ordinances apply to (commercial by size, public, and residential multifamily), who can access the disclosure, and required action of the building owner.80
Early results of the enacted policies (from Austin and New York City) suggest that the policies can have high compliance rates and financial benefits for owners of highly rated (e.g. efficient) properties.81 A 2013 report by Northeast Energy Efficiency Partnerships also shares some of the key lessons learned from these early policies. Among the lessons are: local government can lead by example; energy rating disclosure must be simple to understand and timely (so prospective buyer/renters can use it); utility participation is extremely important to be able to access building energy data (made easier in Seattle and Austin, which have municipal electric utilities).82

PACE Programs
Property Assessed Clean Energy (PACE) programs set out to overcome a key barrier to financing clean energy and energy efficiency: nobody wants to pay for energy improvements that won’t pay off before they sell a property.
PACE programs solve the dilemma by allowing municipalities to offer upfront cash for energy efficiency improvements and on-site renewable energy to home and businesses owners, and allowing them to pay back their loans via their property tax bills. Long-term loans make more substantial projects with higher energy savings possible, and using the property tax bill allows payments to carry over to future beneficiaries of the energy improvements.
PACE can also place cities at the center of energy decisions for their community, making them a hub for information about and resources for saving energy dollars and creating jobs for energy improvements.
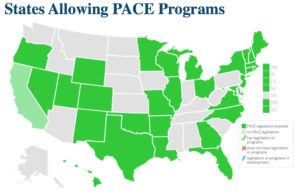 30 states have enacted laws allowing municipalities to create PACE programs, covering 80% of the US population, but programs have been relatively slow to grow.
In May 2010, four active PACE programs had served over 2,000 properties with total financing just over $37 million. By mid-2013, PACE programs had collectively financed hundreds of millions of dollars in residential and commercial retrofits.83,84
Despite the sound concept and growing success, a major barrier to expanding PACE is the Federal Housing Finance Agency (FHFA). It issued a statement in July 2010 arguing that PACE liens – which have higher priority for repayment in the event of bankruptcy – threatened the financial security of mortgage holders. FHFA is wrong: default rates on energy efficiency loans are low and the likely exposure of credit holders is less than $200 per home.85 In fact, owners of energy efficiency properties are less likely to default than those whose homes are less efficient.86 That the data suggests otherwise hasn’t caused the FHFA to repent, and their stance has brought the growth of PACE for residential property to a virtual standstill, although as we will see, several communities defiantly continue to successfully operate such programs.87
The credit crisis in late 2008 also hasn’t done PACE any favors, with banks wary to try a new form of financing home and business energy improvements despite the proven low risk.
In spite of the threat from FHFA and the credit crisis, several communities – particularly those with programs predating the FHFA ruling – have operated very successful residential PACE programs.
Commercial PACE programs, unaffected by the FHFA ruling, have ramped up.
The major recent shift in PACE programs is that several larger financiers (e.g. Ygrene, Figtree, Renovate America, Renewable Funding) have emerged to offer full-service programs to municipalities wary of running their own program. Repayment of financing still uses the property tax bill, but the private companies, not the cities, provide initial financing. It’s likely that such public–private partnerships will help many cities overcome their reluctance to establish local financing programs, at the expense of having the city be the local hub for improving its energy future.
Sonoma County, CA
Sonoma County Energy Independence Program update, 9/24/2013.
The Energy Independence Program of Sonoma County launched in 2009 using general fund dollars and revenue bonds to finance on-site renewable energy and energy efficiency projects for residential and commercial properties. By early 2010, the program had provided $21 million to finance 670 energy retrofits at a 7% fixed interest rate.88
The county responded to the FHFA statement with a lawsuit, and it continued a residential retrofit program, providing extensive disclosure to customers of the risks posed by the FHFA threat.
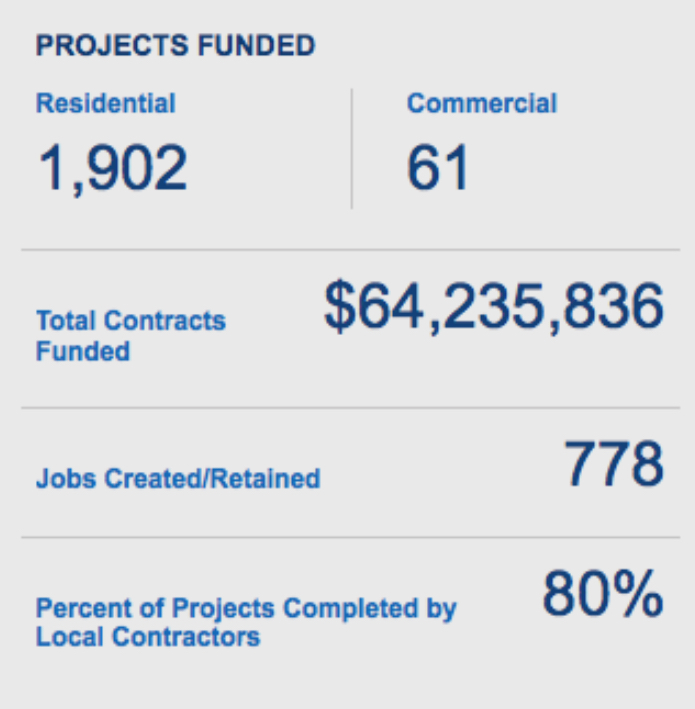
By July 2012, total financing through the program reached $57 million (51 commercial projects and over 1,600 residential ones89).90 In August 2013, Sonoma County’s PACE program reported $63.6 million in financing for 60 commercial and nearly 1,900 residential projects (0.92% of housing units).91
Palm Desert, CA
Another California town, Palm Desert, also launched its Energy Independence program in 2008, with $5 million from its general fund and redevelopment agency. The program was expanded with an additional $6 million in 2010, shortly before the FHFA decision was handed down.
The Palm Desert program was briefly suspended, but like Sonoma County, it resumed the residential retrofit program and continued to offer a modest commercial PACE program.
By mid-2010, the program had financed improvements on 4 commercial and 216 residential properties at 7% interest.92 By mid-2013, the city had completed projects on 336 properties (mostly residential) and provided $6.5 million in financing. Completed residential projects account for nearly 1% of the city’s 37,000 residential properties.
California legislation passed since the program began allows for greater aggregation of PACE programs (among multiple municipalities). Palm Desert will likely suspend their independent PACE program and join one of the large aggregations by the end of 2013.93 The larger programs will presumably provide lower administrative costs and be able to get lower interest rates by selling bonds to finance improvements in larger increments.
Babylon, NY
The Long Island Green Homes program was one of the first PACE programs when it launched in 2008 and remains one of the most successful. By December 2011, the program had financed retrofits of 1% of the homes in the community.94,95
As of August 2013, the program had resulted in over 1,100 retrofits – nearly 2% of residential properties in the city – with an average annual energy savings of $1,300.96
The genius behind Babylon’s program was the source of financing. The town had a reserve of $25 million in its solid waste fund due to reducing waste with recycling. An amendment to the Solid Waste Code adding carbon as a waste allowed the city to tap into its reserve to finance energy efficiency improvements that reduced carbon waste. Residents were able to “borrow” money from the city at 3% interest for substantial energy efficiency improvements, a much lower rate than in other cities. The low interest rate likely explains why Babylon’s PACE program has the highest participation rate (2% of residential properties) of any residential program.
For more information, see:
- Guide to Energy Efficiency and Renewable Energy Financing Districts (UC Berkeley, 2009)97
- Municipal Energy Financing: Lessons Learned (ILSR, 2010)98
- PACE: An Overview, Update, and the Future [presentation] (ILSR, 2010)99
- PACE 101100
- PACENOW list of active and forthcoming programs101
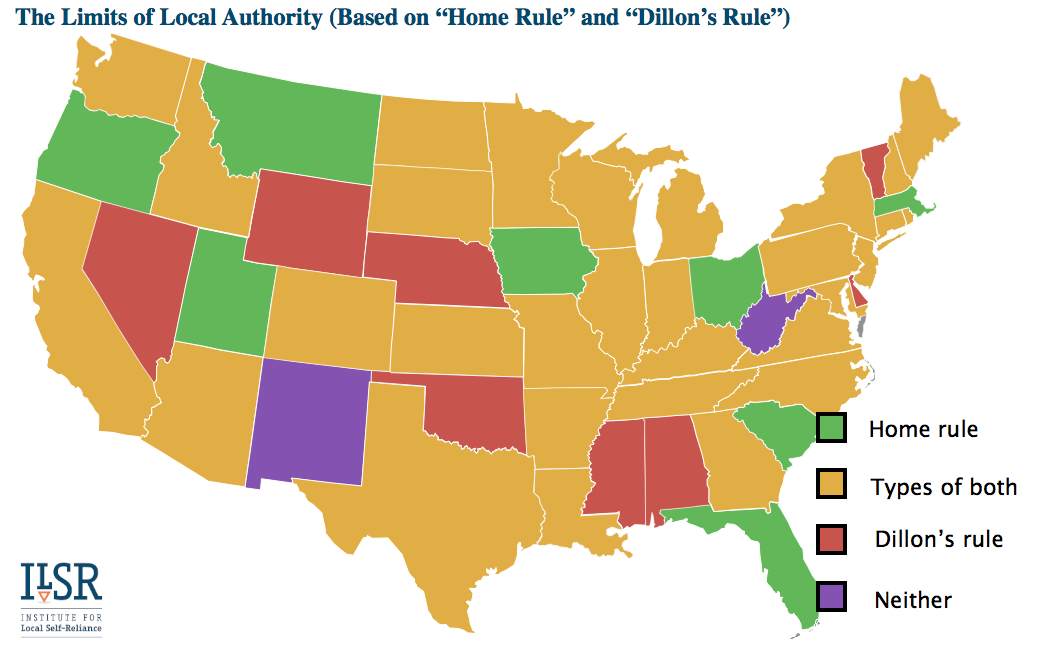
The Limits of Local Authority
The cities highlighted in this report represent leaders on local energy policy, but it would be unfair not to mention that many cities simply lack the authority to adopt many of these leading rules.
While the federal constitution typically reserves all powers not expressly given the federal government to the states, states typically do not similarly reserve powers for cities. In fact, an opinion issued by Justice Dillon of the Iowa Supreme Court in the mid-1800s (Clark v. City of Des Moines) set a precedent for local authority that extends to this day in most states:
It is a general and undisputed proposition of law that a municipal corporation possesses and can exercise the following powers and no others: First, those granted in express words; second, those necessarily or fairly implied in or incident to the powers expressly granted; third, those essential to the declared objects and purposes of the corporation, not simply convenient, but indispensable. Any fair, reasonable doubt concerning the existence of the power is resolved by the courts against the corporation, and the power is denied.102
In other words, many cities have only those powers expressly granted them by the state or that are indispensable in being a city. Issues like energy codes or property assessed clean energy programs don’t fit under “Dillon’s Rule.”
On the other hand, many states have instituted a form of “home rule,” that grants powers of self-governance to cities. Home rule is still not like being a state because the state may still draw limits around the authority of home rule municipalities, but it does offer cities more leeway in setting local policy. In some cases, like Building Codes, it allows communities to go beyond the standards set (or left blank) in state law. In others, like PACE programs or Community Choice, the state still has to expressly grant the authority to municipalities. Home rule authority may only apply to certain cities in a state (those that have a local charter, for example) and the level of local authority varies significantly (some municipalities have no local taxing authority, for example, while others have broad powers).
The included map provides a basic overview of the level of local authority in each state. States with home rule grant any municipality at least some level of local authority. States with Dillon’s rule have minimal local authority. States with both tend to offer more authority to certain cities, while others have Dillon’s limited scope of power. A couple states have neither.
Summary
This report highlights eight powerful strategies cities have adopted to boost clean energy and their economies. These communities are just the tip of the iceberg in a sea of cities finding new and innovative ways to keep their economy humming using their own resources and authority. We welcome information from readers on models they’ve seen.
Chattanooga, TN, shows how a municipal utility can improve its service and expand its focus to save its customers millions of dollars and provide essential services for the 21st century economy. Sonoma County, CA, shows how a local government can make a dent in energy use (and greenhouse gas emissions) and boost local hiring, without owning its own utility. Babylon, NY, shows that existing revenue streams can be repurposed in ways that save citizens on their energy bills, repays the city, and stems the flow of energy dollars out of a community.
Not every community can use every power. Around 2,000 communities get their power from municipally-controlled utility, but many don’t. Cities can change building codes in many states, but many more cannot. 30 states give cities the authority to establish local financing programs for energy efficiency and clean energy, but 20 do not.
But every community has the power to do something to improve its economic future without relying on rules or money from the state or federal government. Every community can do more than it does. And every community stands to do better if it explores the extent of its authority to create jobs with local clean energy policies.
This is part three of our City Power Play Report, a report released in October 2013 about the types of policy solutions cities can enact to increase their ownership of renewable energy. Read part 1 and part 2, published last week.
For timely updates, follow John Farrell on Twitter or get the Energy Democracy weekly update.
Have a tip for CleanTechnica? Want to advertise? Want to suggest a guest for our CleanTech Talk podcast? Contact us here.
Latest CleanTechnica.TV Video

CleanTechnica uses affiliate links. See our policy here.