How & Why Utilities Make Solar Look Expensive
Originally posted at ilsr.org
In February, I visited the folks at Sustainable Tucson in Arizona who are puzzling over their monopoly electricity provider’s attitude toward solar energy. Tucson Electric Power acquires just 4% of its electricity from renewable resources (and over 70% from coal), despite being at the heart of the best sunshine in the country. The red arrow shows Tucson on this map of the nation’s solar resource:
Despite a world-class solar resource, the Tucson utility intends to install far more power plants using natural gas than solar over the next 15 years. Might it be due to their inflated cost of solar?
The utility’s 2014 resource plan suggests that it hasn’t grasped (or refuses to seize) the opportunity. Although it forecasts growth in renewable energy by 600 megawatts (MW) in the next 15 years, it’s only half the capacity increase it intends for natural gas (1200 MW).
It all comes down to numbers.
In TEP’s integrated resource plan for 2014, the utility estimates the cost of new natural gas generation between $88 and $119 per megawatt-hour (or 8.8 to 11.9 cents per kilowatt-hour, the unit of measure for residential consumption). For solar generation, it suggests, the cost is over 16 cents per kilowatt-hour (kWh).
But for a sunshine resource, TEP’s calculation is a bit shady.
For starters, it includes a component for “system integration and backup costs” of 5.2 cents per kWh. This means that TEP implies it must build or buy backup generation for any moment that the sun is not shining at maximum capacity.
Here are several reasons that this line item is—to put it mildly—problematic:
- Traditional power plants are also unavailable at times––these are “unplanned outages” in utility-speak––but the utility doesn’t build two power plants for every one it uses. It has a “reserve margin”––power plants available on standby in the event of a major outage. The reserve margin for the regional grid (the Western Electricity Coordinating Council) is over 33% of the system peak demand. In other words, there are loads of power plants already built and available for backup. [note: TEP suggests that its transmission line connection to other utilities are constrained, and that it operates more like an island. It did not disclose what its own backup/reserve margins are.]
- Utility systems are already built to handle a large amount of minute-to-minute variability. If intermittent clouds over solar could bring down the grid, then so could the cycling of refrigerators or air conditioners.
- Utility systems are already built to handle variability from day to day, but much of solar’s variability is predictable. After all, we know when the sun rises and sets.
- Solar’s output tends to follow system peak usage––its best output is on hot, sunny, summer afternoons when the electricity system is near its peak utilization. Half of the output from a solar array with a tracker (e.g. it follows the sun from east to west) comes during summer peak load on TEP’s system.
- Grid engineers agree that there may be a moment in time when grid integration costs are non-zero for solar, but it will require unprecedented amounts of solar on the grid (upward of 15% or more of total energy supply). Even at this level, simple solutions like geographic dispersion of solar arrays can cut integration and backup costs by 100-fold.
In other words, TEP’s integration and backup costs have inflated the cost of solar by up to 45%.
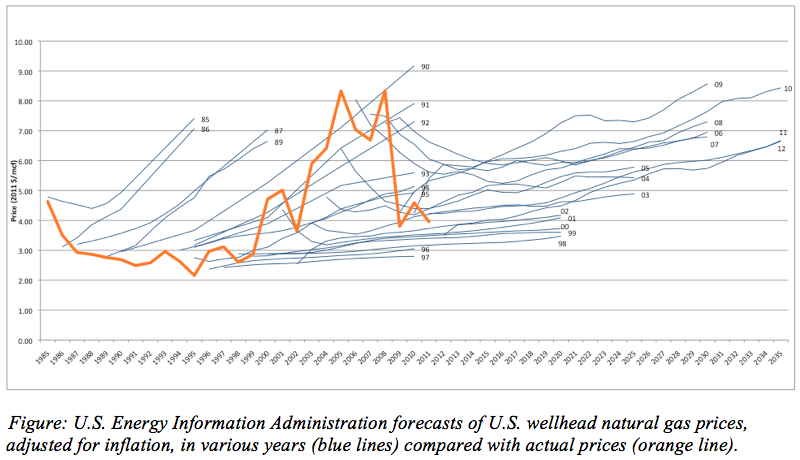
Cutting that single line out, we have a remarkably different picture. Now solar at 11.1¢ per kWh is competitive with the proposed natural gas plants at 8.8-11.9¢. Keep in mind that almost all of the solar costs are upfront and that fuel costs are a guaranteed zero, whereas any volatility in natural gas prices will be passed through to ratepayers. See below for a retrospective on natural gas price volatility (with Energy Information Administration price forecasts) and solar price volatility. The irony is that TEP is completely upfront about a forecast doubling of gas prices by the end of the 15-year planning horizon (p295), but since those costs pass through to ratepayers….
Natural gas price volatility
Solar price volatility

The solar cost hijinks don’t stop with backup and integration costs.
A price of 11.1¢ seems more reasonable, but compare it to the System Advisor Model from the National Renewable Energy Laboratory. This software package models the solar resource and cost for the entire country, and its default values incorporate years of data tracking on solar costs. Not including any incentives, and with a capital cost that’s 15% higher (per Watt) than the $1.99 used by TEP, the model spits out a levelized cost for solar of 7¢ per kilowatt-hour. Throw in the federal 30% tax incentive and the model suggests that the breakeven price for a 1 megawatt solar array in Tucson is 4.5¢ per kilowatt-hour, 60% lower than TEP’s figure!
But don’t rely on cost modeling. Five years ago, Pima County signed a power purchase agreement for a solar array at the Roger Road Wastewater Reclamation Facility for just under 10¢ per kWh. It has another contract for the 5 MW Prairie Fire Solar Plant to buy electricity for 9.3¢ per kWh. In 2014, Chief Contracts & Procurement Manager Terry Finefrock says the county signed another purchase agreement for solar at Green Valley for 5.7¢ per kWh (which compares to the the 4.5¢ figure from the model above plus a small margin). In other words, Tucson residents and businesses can already buy solar for one-third the cost the utility suggests in its official resource plan!
The following chart illustrates the remarkable gap between the utility’s solar cost estimate and the real world cost.

By now, it should be clear how utilities make solar look expensive. They obfuscate, they hid behind “grid stability” and “variability,” they exaggerate.
But why?
Like many incumbent monopolies, TEP sees its business model about to founder on the rocks of distributed power. Conservation and energy efficiency are reducing revenues. Distributed solar is giving customers unprecedented opportunity to diversify their energy supply, undercutting sales and demand for new power plants (the latter is the revenue and profit lifeline for shareholder-owned utilities). The impending fiscal crisis is the result of a utility regulatory system that pays TEP to play the wrong game. TEP can’t maintain profits for its shareholders if its customers can slip from the monopoly grasp.
But rather than explore business models compatible with low-cost solar, TEP implies that solar is too costly and doubles down on last century’s business model. Its resource plan will commit billions of dollars to new fossil fuel infrastructure that will take decades for Tucson customers to repay. It will require approximately 1.7 billion gallons of water per year for new natural gas power production. And finally, it will undermine the city’s hope to reach net zero greenhouse gas emissions by 2040 because the new power plants will be operated until 2070 or beyond.
New since I originally wrote this: TEP is proposing to reduce compensation for customer-owned solar.
There’s almost no place in America where solar is cheaper than in Tucson, but its electric utility seems poised to deliberately ignore the opportunity for clean, local, and cost-effective energy production. And we know why.
This article originally posted at ilsr.org. For timely updates, follow John Farrell on Twitter or get the Democratic Energy weekly update.
Assumptions for System Advisor Model
- 4 kW DC system, with 1st-year output of 7,078 kWh
- $3.29/Watt installed cost
- $20/kW-yr maintenance costs
- 0.5% annual panel degradation
- 70% debt at 5% for 10 years
- 2.5% inflation
- 2.5% real discount rate (5% nominal)
- Other settings are the system defaults
Have a tip for CleanTechnica? Want to advertise? Want to suggest a guest for our CleanTech Talk podcast? Contact us here.
Latest CleanTechnica.TV Video

CleanTechnica uses affiliate links. See our policy here.