The Three Biggest Solar Charts of 2014
Originally published on ilsr.org.
The rise of solar power allows a further democratizing of the electricity system, and these charts illustrate how 2014 was a banner year for solar, but particularly distributed solar power.
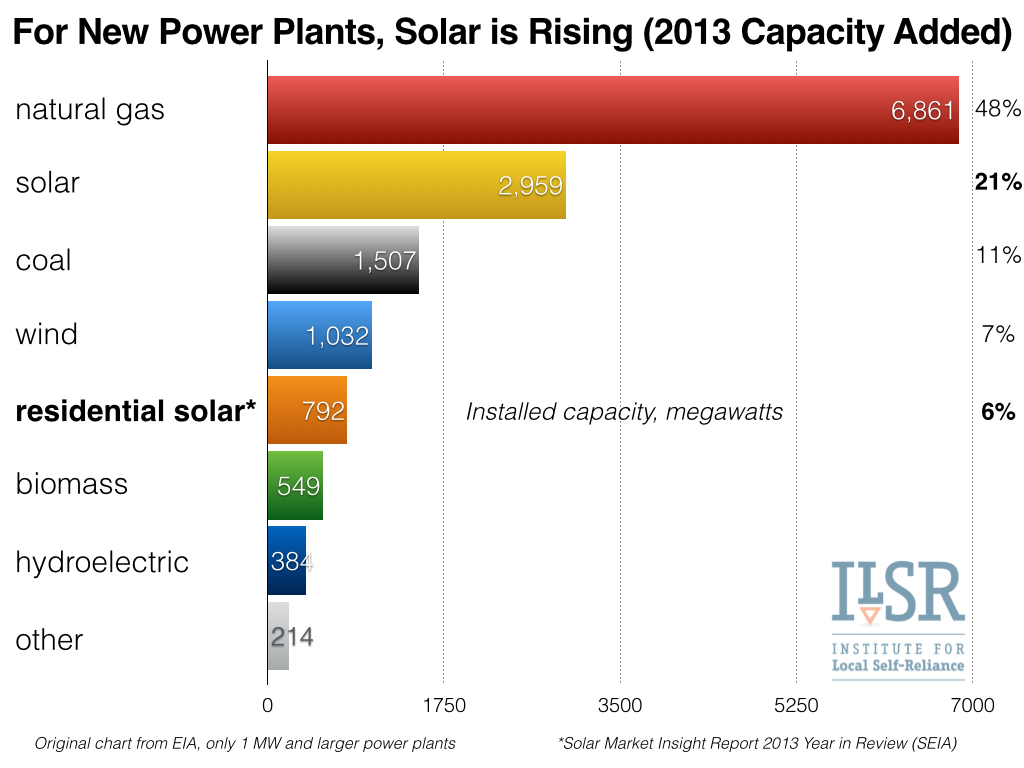
First, the following chart shows that 2014 opened on the heels of an impressive year of solar growth. In 2013, over 20% of new power plant capacity was from solar power, and a further 6% from residential solar alone! This is up from just 12% in 2012.
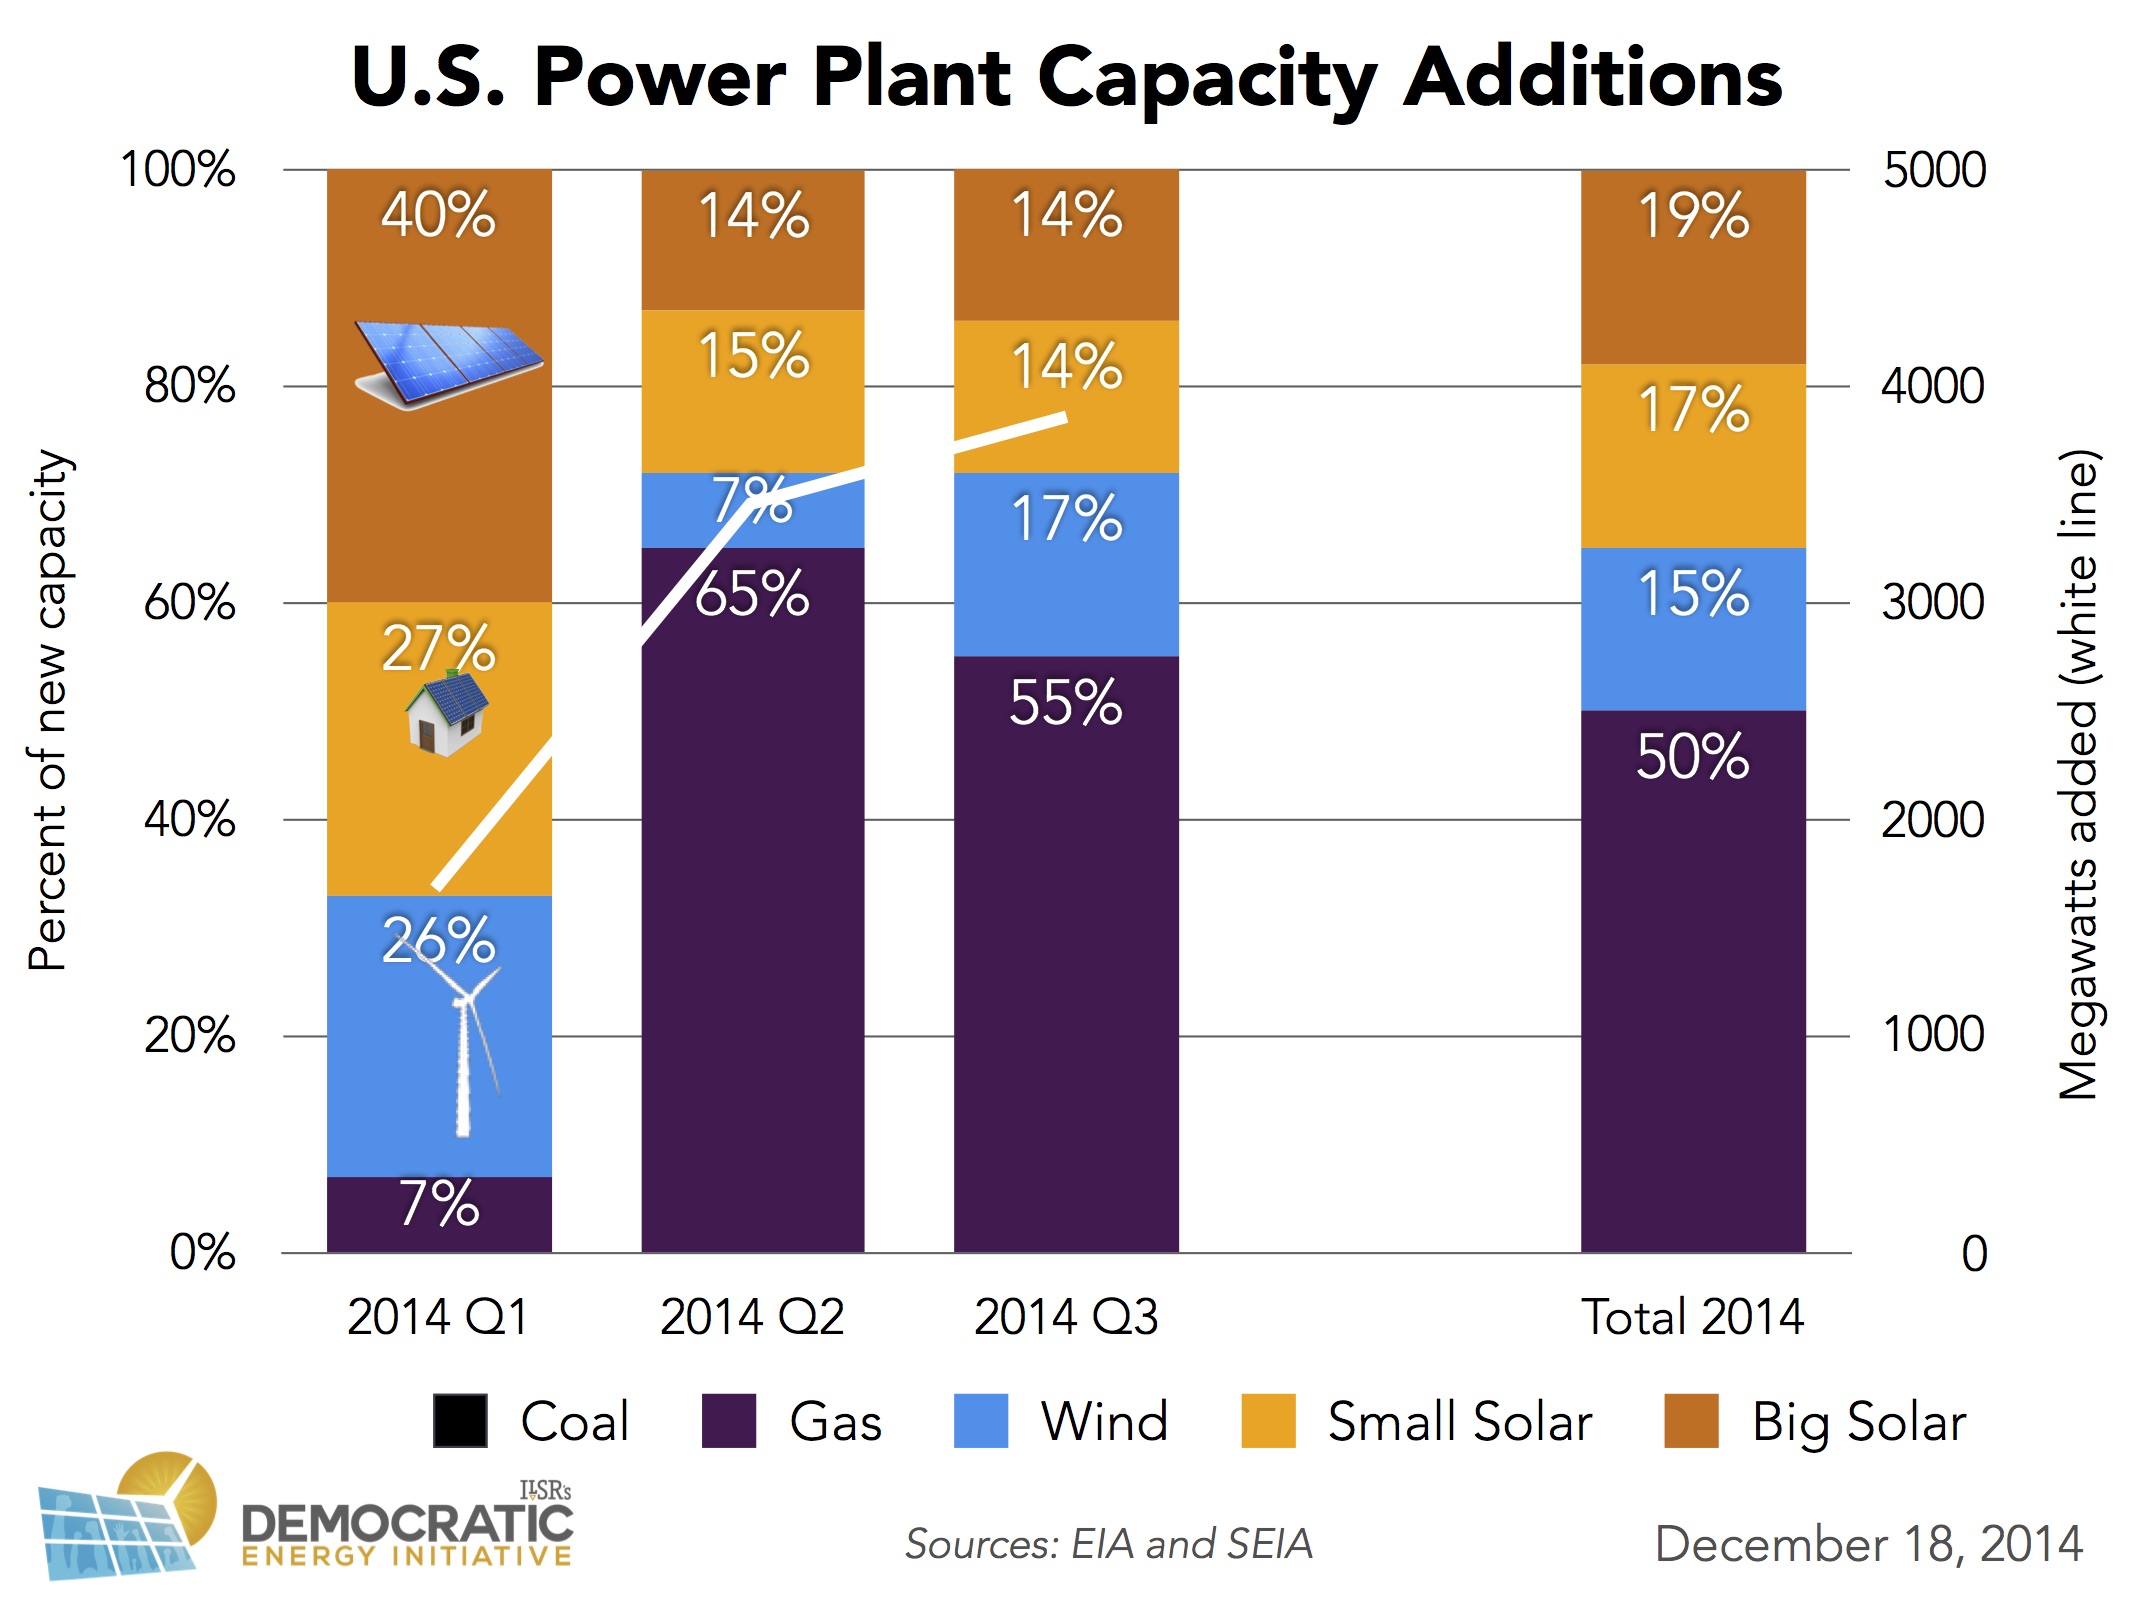
The year 2014 opened with a solar spark, with nearly two-thirds of new electricity generation coming from solar in the 1st quarter of 2014! Over the first three-quarters of last year, solar provided 36% of new capacity, with an astounding 17% from projects 1 megawatt and smaller on residential and commercial property. Yes, nearly 20 percent of new power plants were located at U.S. homes and businesses, not on power company property!
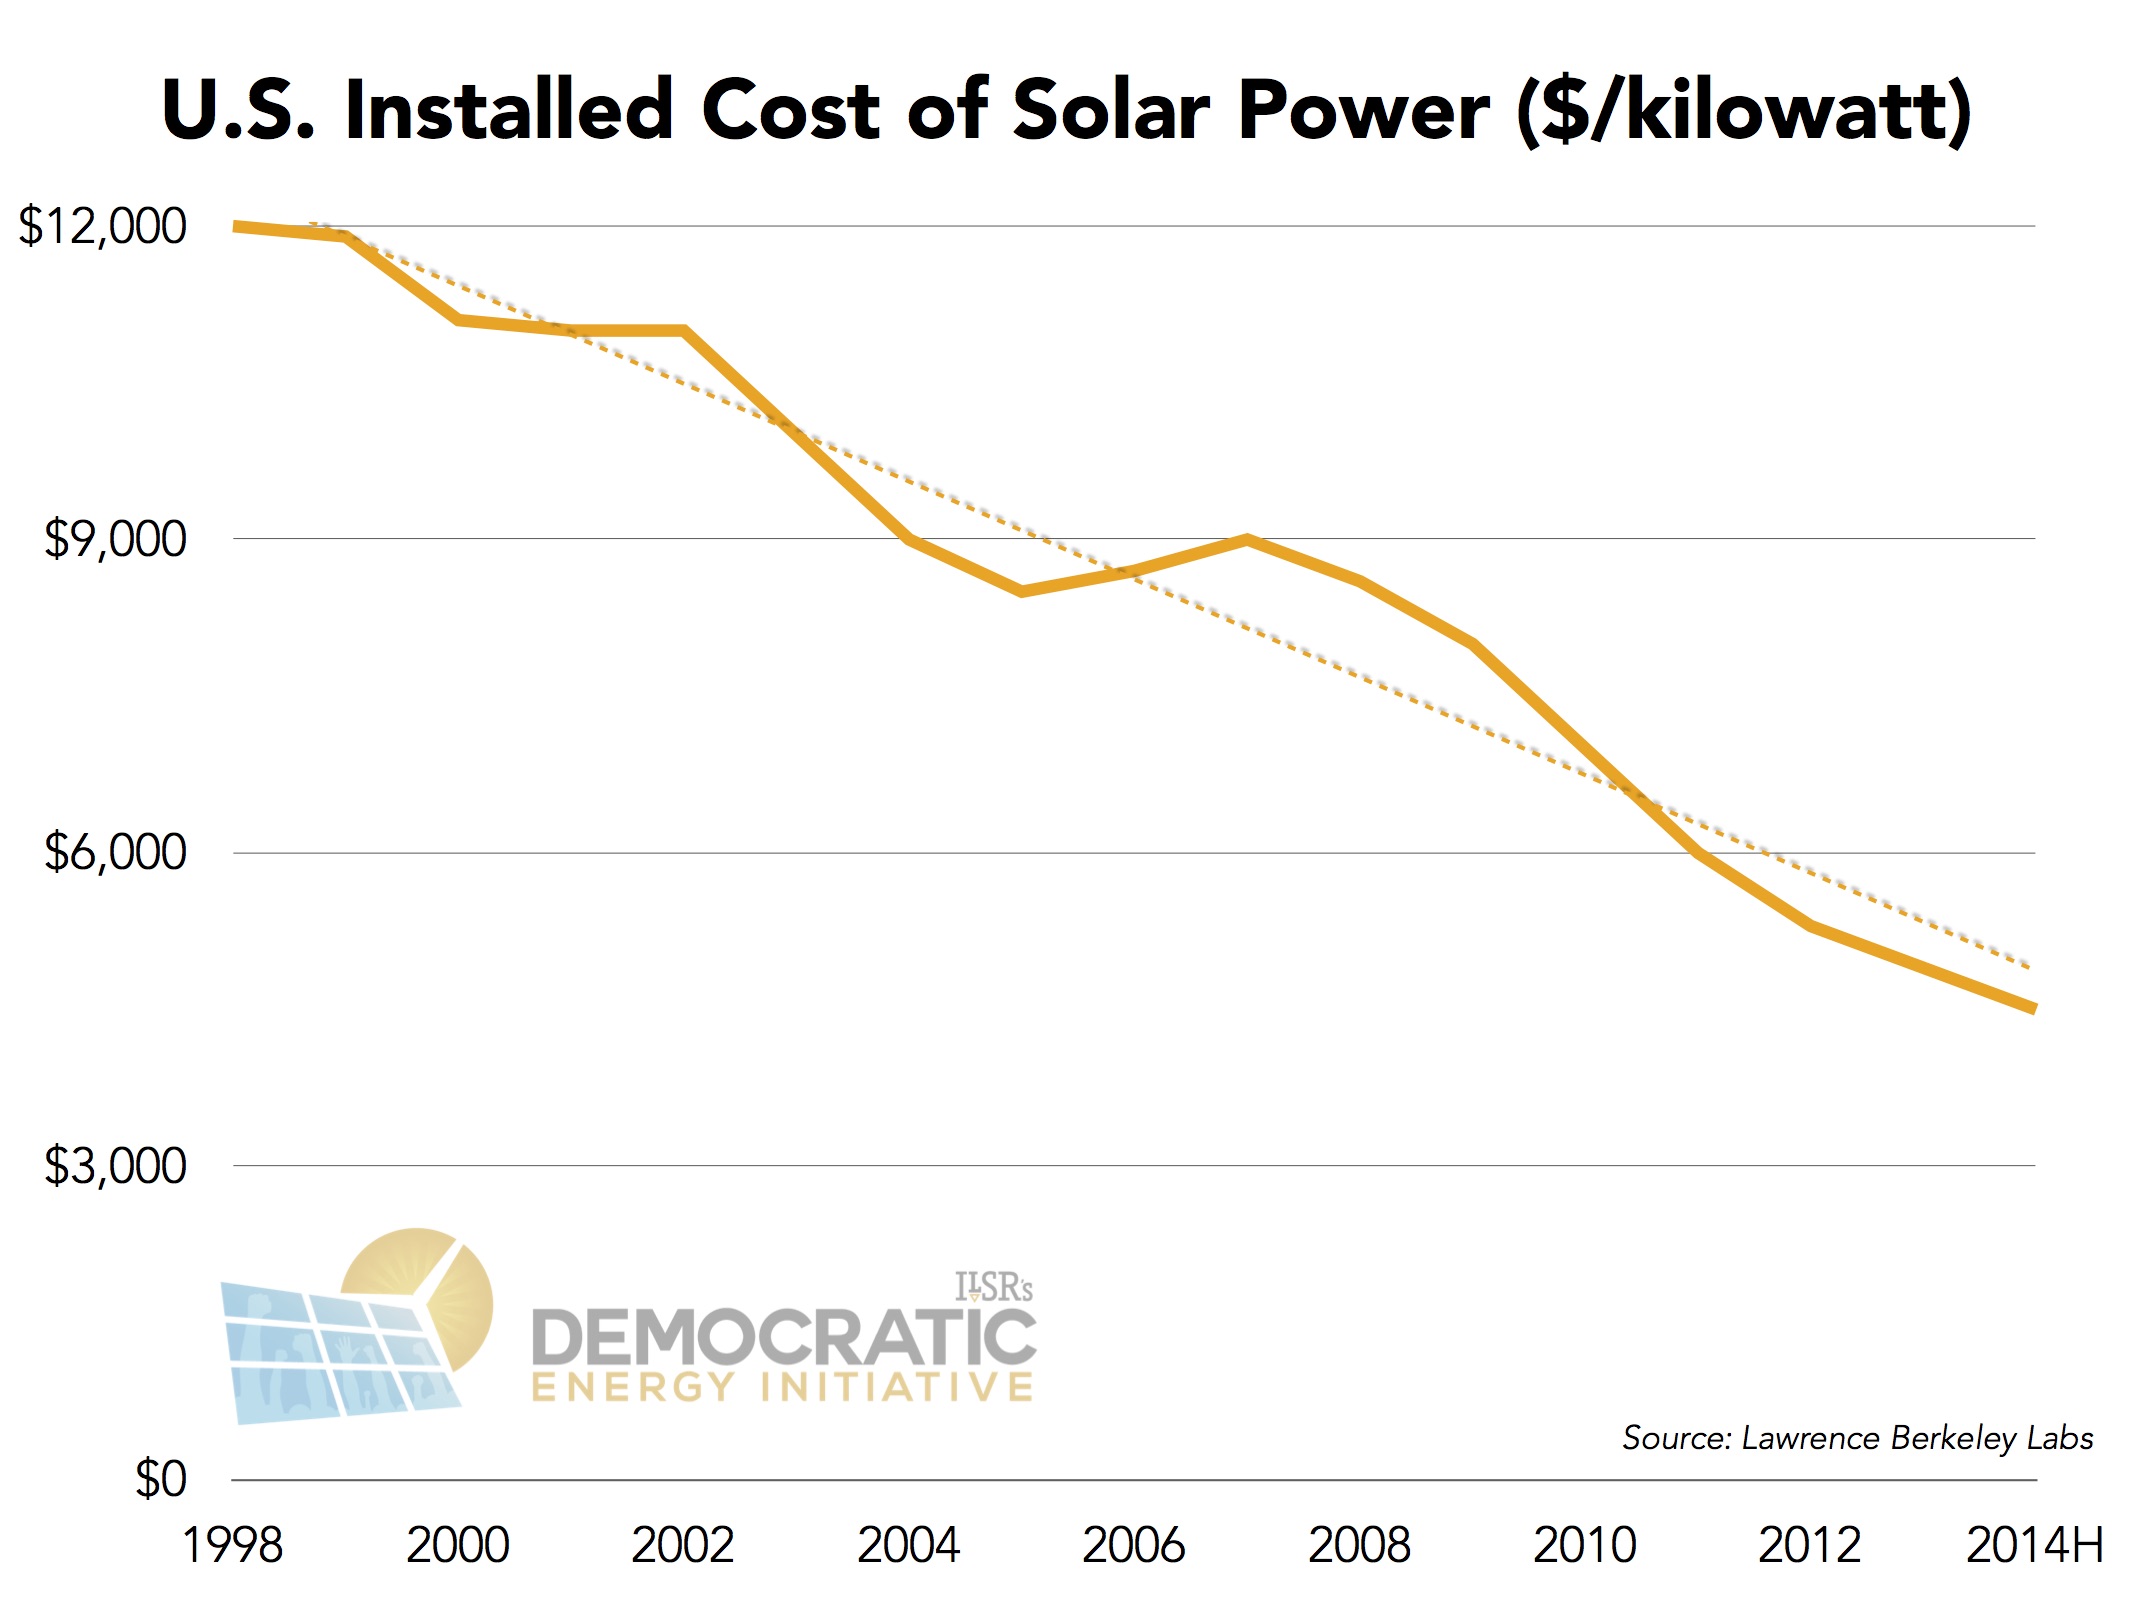
The growth of solar was driven in part by continued falling costs. The installed cost of solar fell 8-9% through the first half of 2014.
The solar wave that continued building in 2014 isn’t likely to recede any time soon, as ever-better economics let more customers seek a solar alternative to their utility. In fact, customer-owned solar has become a flashpoint in state policy battles between electric companies and their customers, even over the future business model of the electricity system. Along with energy efficiency, it represents a $48 billion opportunity for electric customers to reclaim money they currently send to their electric provider.
Does the solar success in 2014 mean 2015 will be another banner year for solar power? It’s hard to see why not.
This article originally posted at ilsr.org. For timely updates, follow John Farrell on Twitter or get the Democratic Energy weekly update.
Have a tip for CleanTechnica? Want to advertise? Want to suggest a guest for our CleanTech Talk podcast? Contact us here.
Latest CleanTechnica.TV Video

CleanTechnica uses affiliate links. See our policy here.