Top Solar Power States Per Capita (Updated) vs Top Solar Policy Leaders (CleanTechnica Exclusive)
Last year, I put together rankings of the top solar power countries per capita, per GDP, and per TWh of electricity production. In January, I then created rankings of the top solar power states per capita and followed those up with rankings of the top solar power states per capita vs the top solar power countries per capita. Check out those previous rankings and some similar wind power rankings via the links on the bottom of this page.
Recently, I got end-of-2012 solar state capacity data from GTM Research — data that’s included in GTM Research and SEIA’s 4th quarter 2013 US Solar Market Insight report (the Q1 2013 report is out now). So, now, I used the provided data and state population data to put together updated top solar power states (per capita) rankings. Below are the top US solar states for total solar power capacity per capita and the top US solar states for new solar power capacity.
I’ve also received end-of-2012 solar capacity country data and will be updating those rankings and the “top solar countries vs top solar states” rankings in the coming days. Stay tuned! For now, here are the state solar rankings and some thoughts on how they compare with the top state solar policy rankings:
Top Solar Power States Per Capita (Total Solar Power Capacity)
Again, the solar power capacity data come from GTM Research and SEIA. The population data come from the United States Census Bureau, through Wikipedia.
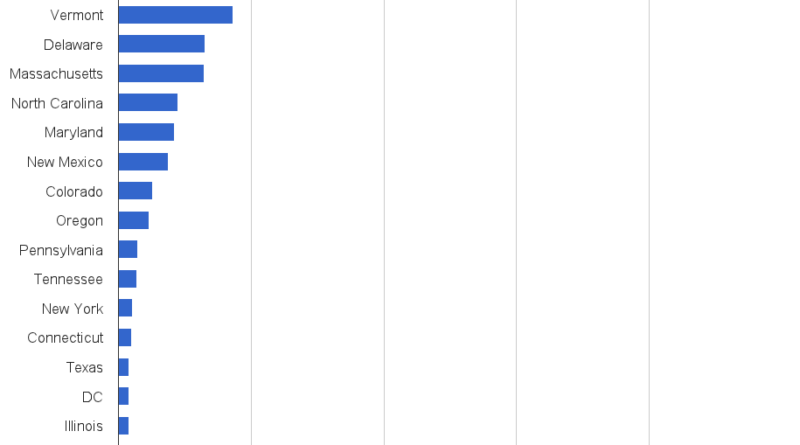
Here’s a chart of the leaders:

Image Credit: Zachary Shahan / CleanTechnica
And here’s a table of the leaders:

Image Credit: Zachary Shahan / CleanTechnica
Top Solar Power States Per Capita (New Solar Power Capacity)
Here are the leaders in new solar power per capita, for solar power installed in 2012 (again, solar power capacity data come from GTM Research and SEIA, while population data come from the United States Census Bureau).

Image Credit: Zachary Shahan / CleanTechnica
And the table:

Image Credit: Zachary Shahan / CleanTechnica
Thoughts?
Some of the things that stand out to me are that the top 4 states for solar power capacity (total and new) per capita — Arizona, Hawaii, Nevada, and New Jersey — don’t top Solar Power Rocks’ list of the top solar power policy states. Arizona is #7 on that list, Hawaii is #18, Nevada is #19, and New Jersey is #9. Naturally, Arizona, Nevada, and Hawaii all have good solar radiation levels (which is not a factor in Solar Power Rocks’ ranking). Additionally, Hawaii has very expensive electricity — electricity prices are taken into account in that ranking, but they are not a huge factor in the total score. None of that explains New Jersey’s solar power per capita leadership, which I think is partly driven by relatively high electricity prices but is largely driven by some very strong solar policies the state has had.
The solar policy leaders, according to Solar Power Rocks, and their rankings according to new solar power per capita (in parentheses) are as follows:
- Massachusetts (#8)
- Maryland (#10)
- New York (#16)
- Delaware (#7)
- Colorado (#12)
- DC (#19)
- Arizona (#1)
- New Mexico (#11)
- New Jersey (#3)
- Illinois (#20)
So, they’re all within the top 20 per capita, at least. However, they certainly aren’t a close match.
Doing the same comparison but reversed — the total solar power per capita leaders listed below and their solar policy ranking in parentheses — here’s the result:
- Arizona (#7)
- Hawaii (#18)
- Nevada (#19)
- New Jersey (#9)
- New Mexico (#8)
- California (#12)
- Delaware (#4)
- Colorado (#5)
- Vermont (#15)
- Massachusetts (#1)
And, just to be comprehensive, here’s a comparison of the new solar power per capita leaders and their solar policy rankings (almost the same as the list above):
- Arizona (#7)
- Hawaii (#18)
- Nevada (#19)
- New Jersey (#9)
- California (#12)
- Vermont (#15)
- Delaware (#4)
- Massachusetts (#1)
- North Carolina (#14)
- Maryland (#2)
So, clearly, the top solar power capacity lists don’t differ too much from the top solar policy list, but they do differ quite a bit.
One last interesting point I’ll note is that 5 of the 7 states with the best payback over 20 years (all surpassing $30,000 in savings) based on this 2011 research (see infographic below) are also in the top 6 for total solar power capacity per capita. Now that’s some correlation!
Those states are Hawaii, Arizona, Nevada, New Mexico, and California. The two states that didn’t make it very high in the solar power per capita ranking despite high savings over 20 years are Florida and New York. Notably, New York has great solar policies,… but it includes New York City, which has millions and millions of people living in apartments. Meanwhile, Florida’s solar policies are quite lame. It ranked #23 on Solar Power Rocks’ list. That is likely holding residents back from going solar in The Sunshine State. I also wonder if Florida’s high number of retirees has anything to do with the low solar power per capita ranking — they might see a solar power investment as less attractive than younger homeowners.

Anyway, those are my initial thoughts. Yours?
And while you’re thinking, here are those links to previous CleanTechnica rankings that I mentioned at the top of the post:
- Top Solar Power States Per Capita
- Top Solar Power Countries (Per Capita, Per GDP, Per TWh of Electricity Produced, & in Total)
- Top Solar Power States vs Top Solar Power Countries
- Most Solar-Friendly States — 2013 State Solar Policy Rankings (Infographic)
- Top Wind Power Countries Per Capita
- Top Wind Power Countries Per GDP
Have a tip for CleanTechnica? Want to advertise? Want to suggest a guest for our CleanTech Talk podcast? Contact us here.
Latest CleanTechnica.TV Video

CleanTechnica uses affiliate links. See our policy here.