EU Installs 8 Gigawatts Of Solar In 2018, Up 36%
The European Union installed 8 gigawatts (GW) of new solar capacity in 2018, according to the region’s solar trade body SolarPower Europe, an increase of 36% over 2017 figures.
The European Union installed 8 gigawatts (GW) of new solar capacity in 2018, according to the region’s solar trade body SolarPower Europe, an increase of 36% over 2017 figures.
A new 44-megawatt biomass district heating plant is replacing natural gas with sustainable heat at 99% plant efficiency in one Dutch city.
Originally published on The ECO Report. This article replaces a previous article we published about the Dutch PV numbers in question. A report that the Dutch feed-in-tariff (FiT) system resulted in the installation of 665.470 MW of grid-connected PV installations by the end of 2013 appears to be erroneous. According … [continued]
Sports are thriving businesses for many communities and countries. Soccer is our family’s personal favorite. We are not alone — the game is the most popular in the world. The World Cup creates an influx of business for any country where it is held — this sport is the heart … [continued]
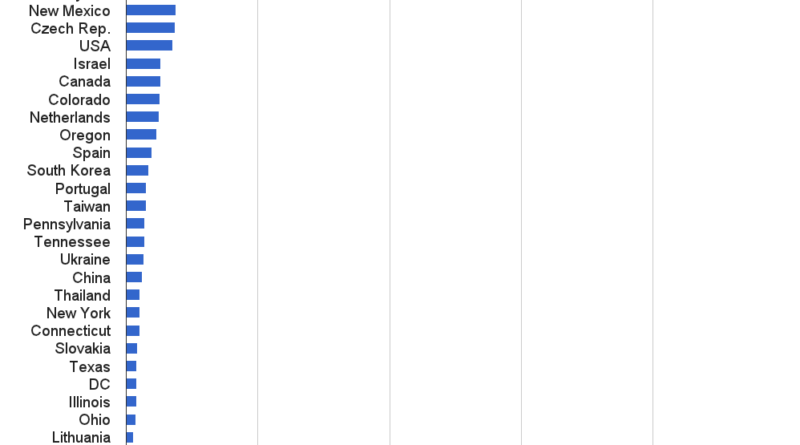
Following our top solar states rankings and our top solar countries rankings, below are rankings that mix the two. The rankings are for total and new solar power capacity per capita as well as total and new solar power per GDP. I thin the results are very interesting…. If you … [continued]

–> Update: Also see the new top solar power countries vs top US solar states rankings. Following up on my top solar power state rankings, below are rankings of the top solar power countries per capita and per GDP. These solar power by country rankings are key to seeing who the … [continued]
What are the top countries in the world for new and total installed solar power? Or for solar power per capita? Or per GDP? Or per electricity production? Check out this post for the answers. […]